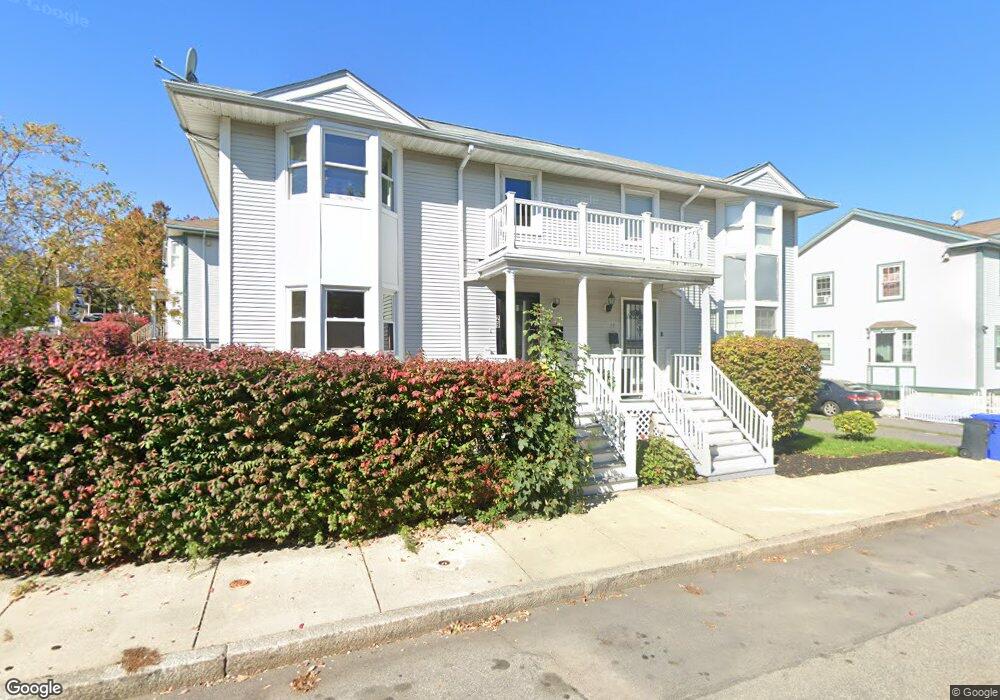
27 Dennis St Roxbury, MA 02119
Dudley-Brunswick King NeighborhoodEstimated Value: $343,000 - $495,000
3
Beds
2
Baths
1,400
Sq Ft
$314/Sq Ft
Est. Value
About This Home
This home is located at 27 Dennis St, Roxbury, MA 02119 and is currently estimated at $440,232, approximately $314 per square foot. 27 Dennis St is a home located in Suffolk County with nearby schools including Dudley Street Neighborhood Charter School and City on a Hill Charter Public School.
Ownership History
Date
Name
Owned For
Owner Type
Purchase Details
Closed on
Oct 31, 2024
Sold by
Pires Jose L and Pires Marcelino Domingas
Bought by
Jpdm Rt and Pires
Current Estimated Value
Purchase Details
Closed on
Dec 30, 2013
Sold by
Dudley St Nbhd Initiat
Bought by
Wong Lisa J
Purchase Details
Closed on
Dec 28, 2007
Sold by
Dudley Neighbors Inc
Bought by
Dni Winthrop Ests Llc
Create a Home Valuation Report for This Property
The Home Valuation Report is an in-depth analysis detailing your home's value as well as a comparison with similar homes in the area
Home Values in the Area
Average Home Value in this Area
Purchase History
| Date | Buyer | Sale Price | Title Company |
|---|---|---|---|
| Jpdm Rt | -- | None Available | |
| Jpdm Rt | -- | None Available | |
| Wong Lisa J | $118,489 | -- | |
| Dni Winthrop Ests Llc | -- | -- | |
| Wong Lisa J | $118,489 | -- | |
| Dni Winthrop Ests Llc | -- | -- |
Source: Public Records
Mortgage History
| Date | Status | Borrower | Loan Amount |
|---|---|---|---|
| Previous Owner | Dni Winthrop Ests Llc | $65,500 |
Source: Public Records
Tax History Compared to Growth
Tax History
| Year | Tax Paid | Tax Assessment Tax Assessment Total Assessment is a certain percentage of the fair market value that is determined by local assessors to be the total taxable value of land and additions on the property. | Land | Improvement |
|---|---|---|---|---|
| 2025 | $2,716 | $234,500 | $77,385 | $157,115 |
| 2024 | $2,434 | $223,300 | $60,291 | $163,009 |
| 2023 | $2,284 | $212,700 | $57,429 | $155,271 |
| 2022 | $2,204 | $202,600 | $54,702 | $147,898 |
| 2021 | $2,059 | $193,000 | $0 | $193,000 |
| 2020 | $1,941 | $183,815 | $83,600 | $100,215 |
| 2019 | $1,757 | $166,700 | $84,500 | $82,200 |
| 2018 | $1,664 | $158,800 | $84,500 | $74,300 |
| 2017 | $1,601 | $151,200 | $84,500 | $66,700 |
| 2016 | $1,584 | $144,024 | $84,600 | $59,424 |
| 2015 | $1,435 | $118,489 | $81,500 | $36,989 |
| 2014 | $1,643 | $130,634 | $81,500 | $49,134 |
Source: Public Records
Map
Nearby Homes
- 24 Clarence St Unit 24R
- 80 Blue Hill Ave Unit 5
- 108 Mount Pleasant Ave Unit 108R
- 45 Woodville St
- 101 Mount Pleasant Ave
- 79 W Cottage St
- 119 Blue Hill Ave
- 33 Copeland Park Unit C
- 22 Alaska St
- 59 Perrin St
- 59 Perrin St Unit 1
- 7 Langford Park Unit 3
- 31 Alaska St
- 133 Blue Hill Ave
- Lot 84 Blue Hill Ave
- 21 Dean St
- 66 Burrell St
- 69 Burrell St
- 29 E Cottage St
- 30 Copeland St Unit 1