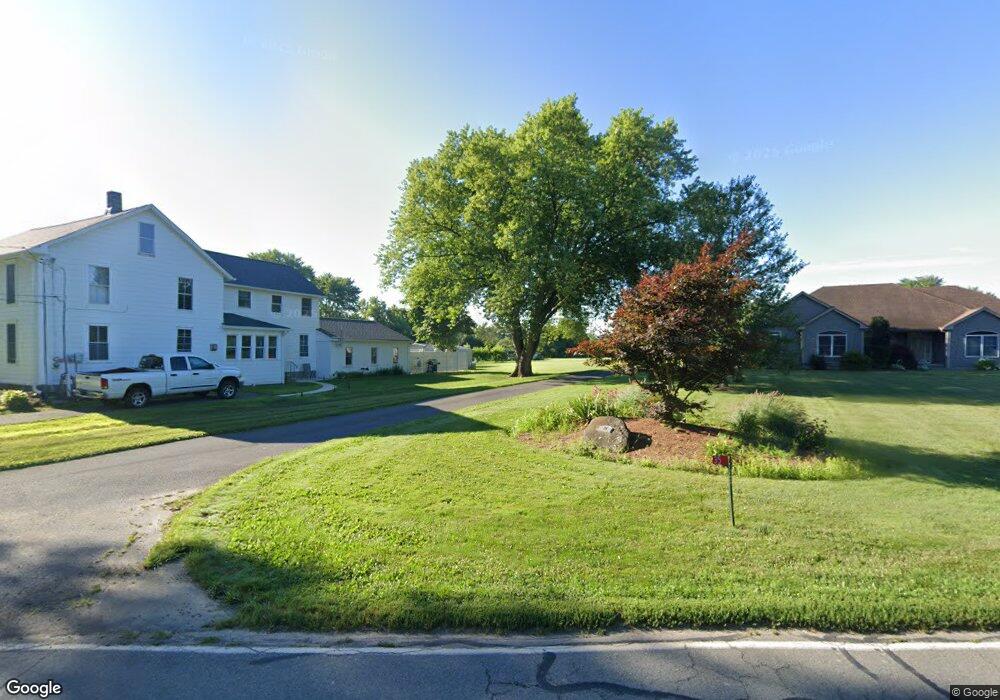
27 Depot Rd Hatfield, MA 01038
Estimated Value: $473,850 - $557,000
5
Beds
2
Baths
1,838
Sq Ft
$271/Sq Ft
Est. Value
About This Home
This home is located at 27 Depot Rd, Hatfield, MA 01038 and is currently estimated at $498,463, approximately $271 per square foot. 27 Depot Rd is a home located in Hampshire County with nearby schools including Hatfield Elementary School and Smith Academy.
Ownership History
Date
Name
Owned For
Owner Type
Purchase Details
Closed on
Mar 31, 2008
Sold by
Bielunis Adam E and Bielunis Constance R
Bought by
Bielunis Brianna K and Bielunis Jared P
Current Estimated Value
Home Financials for this Owner
Home Financials are based on the most recent Mortgage that was taken out on this home.
Original Mortgage
$200,000
Outstanding Balance
$125,298
Interest Rate
5.76%
Mortgage Type
Purchase Money Mortgage
Estimated Equity
$373,165
Create a Home Valuation Report for This Property
The Home Valuation Report is an in-depth analysis detailing your home's value as well as a comparison with similar homes in the area
Home Values in the Area
Average Home Value in this Area
Purchase History
| Date | Buyer | Sale Price | Title Company |
|---|---|---|---|
| Bielunis Brianna K | $250,000 | -- |
Source: Public Records
Mortgage History
| Date | Status | Borrower | Loan Amount |
|---|---|---|---|
| Open | Bielunis Brianna K | $200,000 |
Source: Public Records
Tax History
| Year | Tax Paid | Tax Assessment Tax Assessment Total Assessment is a certain percentage of the fair market value that is determined by local assessors to be the total taxable value of land and additions on the property. | Land | Improvement |
|---|---|---|---|---|
| 2025 | $5,647 | $408,000 | $166,000 | $242,000 |
| 2024 | $5,455 | $356,300 | $145,100 | $211,200 |
| 2023 | $4,543 | $337,000 | $137,600 | $199,400 |
| 2022 | $4,415 | $323,000 | $130,900 | $192,100 |
| 2021 | $4,216 | $297,100 | $119,600 | $177,500 |
| 2020 | $4,020 | $297,100 | $119,600 | $177,500 |
| 2019 | $3,929 | $282,900 | $117,400 | $165,500 |
| 2018 | $3,842 | $282,900 | $117,300 | $165,600 |
| 2017 | $3,682 | $278,500 | $117,300 | $161,200 |
| 2016 | $3,651 | $277,000 | $117,300 | $159,700 |
| 2015 | $3,406 | $258,600 | $106,000 | $152,600 |
| 2014 | $3,276 | $258,600 | $106,000 | $152,600 |
Source: Public Records
Map
Nearby Homes
- 59 N Hatfield Rd
- 0 Straits Rd
- 149 Prospect St
- 79 State Rd
- 8 Aloha Dr
- 3 Frost Ln
- 71 Chestnut St
- 58 Main St Unit 4
- 58 Main St Unit 3
- 27 Prospect St
- 15 S Plain Rd
- Lot 3 Roosevelt St
- 18 Elm St
- 14 Hawley Rd
- 0 North St Unit 73407299
- 92 Masterson Rd
- 121 Rocky Hill Rd
- 27 River Dr
- 208 Rolling Ridge Rd
- 167 Rolling Ridge Rd
Your Personal Tour Guide
Ask me questions while you tour the home.