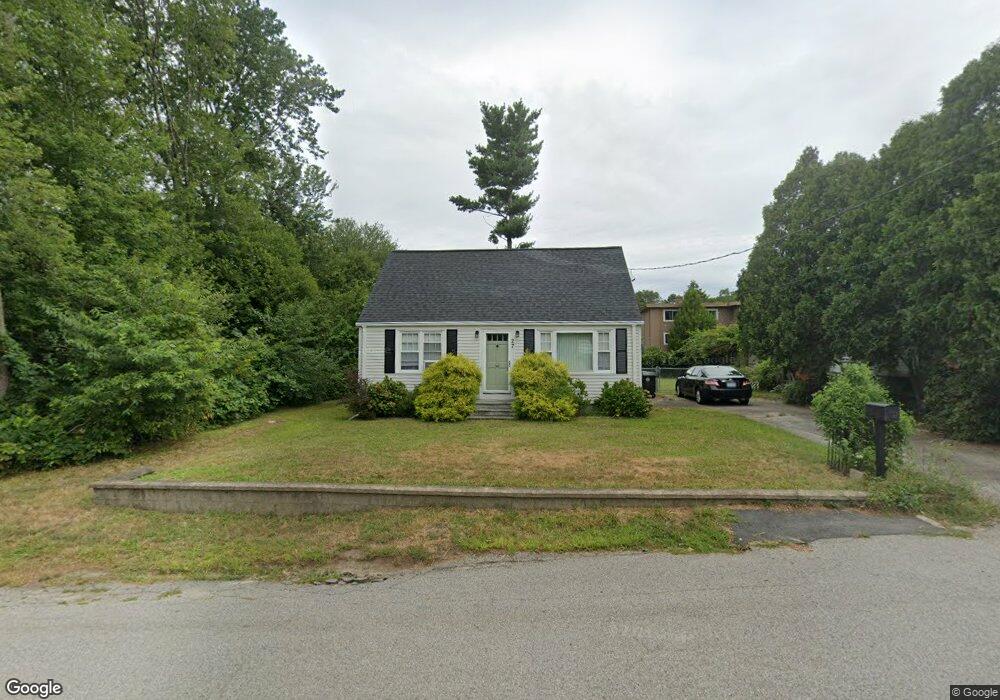
27 Dexter St Coventry, RI 02816
Estimated Value: $348,000 - $385,000
4
Beds
1
Bath
1,080
Sq Ft
$333/Sq Ft
Est. Value
About This Home
This home is located at 27 Dexter St, Coventry, RI 02816 and is currently estimated at $359,108, approximately $332 per square foot. 27 Dexter St is a home located in Kent County with nearby schools including Alan Shawn Feinstein Ms Of Cov, Coventry High School, and Father John V. Doyle School.
Ownership History
Date
Name
Owned For
Owner Type
Purchase Details
Closed on
Jan 30, 2024
Sold by
Tarbox Raymond and Dalton Linda
Bought by
Tarbox Raymond
Current Estimated Value
Purchase Details
Closed on
Apr 25, 2005
Sold by
Nadeau Bridget and Therriault Ann
Bought by
Tarbox Raymond and Dalton Linda
Purchase Details
Closed on
Oct 11, 2001
Sold by
Mccarthy Kyle T and Hummel Elizabeth
Bought by
Nadeau Bridget and Therriault Ann
Purchase Details
Closed on
Oct 1, 1997
Sold by
Hartley William J
Bought by
Mccarthy Kyle T and Hummel Elizabeth
Create a Home Valuation Report for This Property
The Home Valuation Report is an in-depth analysis detailing your home's value as well as a comparison with similar homes in the area
Purchase History
| Date | Buyer | Sale Price | Title Company |
|---|---|---|---|
| Tarbox Raymond | -- | None Available | |
| Tarbox Raymond | $205,000 | -- | |
| Nadeau Bridget | $128,000 | -- | |
| Mccarthy Kyle T | $84,500 | -- |
Source: Public Records
Mortgage History
| Date | Status | Borrower | Loan Amount |
|---|---|---|---|
| Previous Owner | Mccarthy Kyle T | $180,822 | |
| Previous Owner | Mccarthy Kyle T | $23,700 | |
| Previous Owner | Mccarthy Kyle T | $188,800 |
Source: Public Records
Tax History
| Year | Tax Paid | Tax Assessment Tax Assessment Total Assessment is a certain percentage of the fair market value that is determined by local assessors to be the total taxable value of land and additions on the property. | Land | Improvement |
|---|---|---|---|---|
| 2025 | $3,540 | $220,000 | $86,300 | $133,700 |
| 2024 | $3,485 | $220,000 | $86,300 | $133,700 |
| 2023 | $3,373 | $220,000 | $86,300 | $133,700 |
| 2022 | $3,106 | $158,700 | $83,000 | $75,700 |
| 2021 | $3,079 | $158,700 | $83,000 | $75,700 |
| 2020 | $3,529 | $158,700 | $83,000 | $75,700 |
| 2019 | $3,416 | $153,600 | $69,600 | $84,000 |
| 2018 | $3,319 | $153,600 | $69,600 | $84,000 |
| 2017 | $3,223 | $153,600 | $69,600 | $84,000 |
| 2016 | $2,890 | $135,000 | $58,000 | $77,000 |
| 2015 | $2,812 | $135,000 | $58,000 | $77,000 |
| 2014 | $2,753 | $135,000 | $58,000 | $77,000 |
| 2013 | $2,784 | $149,200 | $73,400 | $75,800 |
Source: Public Records
Map
Nearby Homes
- 21 Darton St
- 55 Columbia Ave
- 27 Matteson St
- 22 Colorado St
- 27 Mead St
- 39 Mohawk St
- 91 Windsor Park Dr
- 82 Wood St
- 45 Pine Ave Unit 36
- 37 Holden St
- 31 Anthony St Unit 33
- 33-35 Holden St
- 33 Holden St Unit 35
- 57 Twin Lakes Ave
- 275 E Shore Dr
- 251 E Shore Dr
- 4 Pearl St
- 10 Colonial Rd
- 18 S Main St
- 69 Station St
Your Personal Tour Guide
Ask me questions while you tour the home.