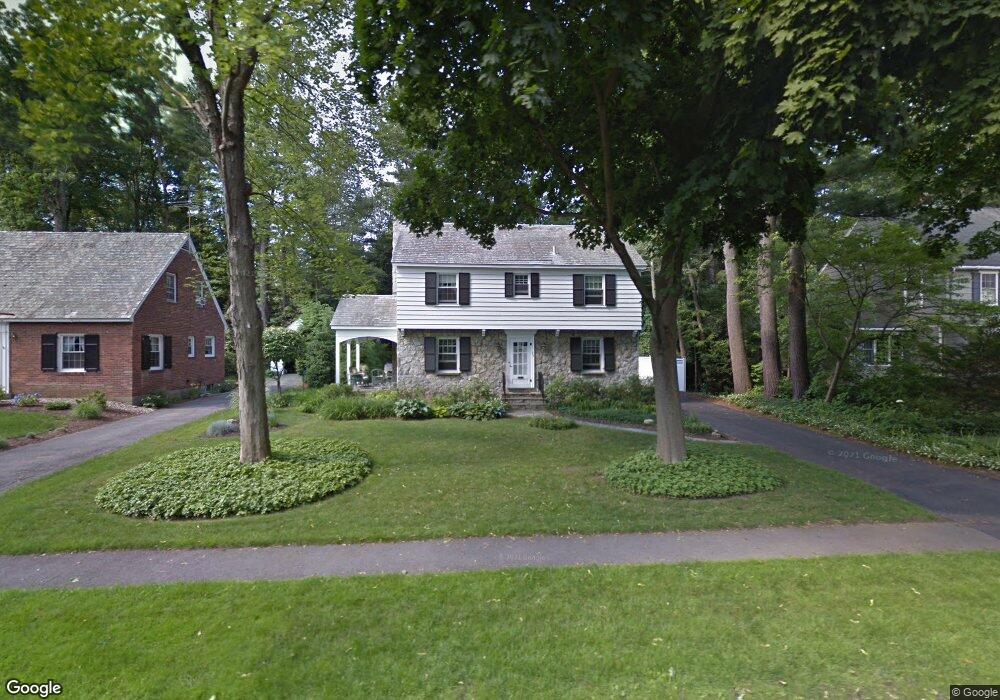
27 Douglas Rd Delmar, NY 12054
Estimated Value: $492,000 - $530,000
4
Beds
2
Baths
2,180
Sq Ft
$235/Sq Ft
Est. Value
About This Home
This home is located at 27 Douglas Rd, Delmar, NY 12054 and is currently estimated at $511,779, approximately $234 per square foot. 27 Douglas Rd is a home located in Albany County with nearby schools including St. Thomas the Apostle School and Mt. Moriah Academy.
Ownership History
Date
Name
Owned For
Owner Type
Purchase Details
Closed on
Jun 14, 2000
Sold by
Mattox Richard H
Bought by
Lanzoni Christopher J
Current Estimated Value
Purchase Details
Closed on
Nov 15, 1999
Sold by
Shea Rosalie L
Bought by
Mattox Richard and Mattox Elizabeth
Create a Home Valuation Report for This Property
The Home Valuation Report is an in-depth analysis detailing your home's value as well as a comparison with similar homes in the area
Home Values in the Area
Average Home Value in this Area
Purchase History
| Date | Buyer | Sale Price | Title Company |
|---|---|---|---|
| Lanzoni Christopher J | $161,000 | Daniel J Rusk | |
| Mattox Richard | $114,500 | -- |
Source: Public Records
Tax History Compared to Growth
Tax History
| Year | Tax Paid | Tax Assessment Tax Assessment Total Assessment is a certain percentage of the fair market value that is determined by local assessors to be the total taxable value of land and additions on the property. | Land | Improvement |
|---|---|---|---|---|
| 2024 | $9,959 | $302,700 | $62,500 | $240,200 |
| 2023 | $9,695 | $302,700 | $62,500 | $240,200 |
| 2022 | $8,897 | $302,700 | $62,500 | $240,200 |
| 2021 | $8,950 | $302,700 | $62,500 | $240,200 |
| 2020 | $8,897 | $302,700 | $62,500 | $240,200 |
| 2019 | $8,239 | $302,700 | $62,500 | $240,200 |
| 2018 | $8,711 | $302,700 | $62,500 | $240,200 |
| 2017 | $8,554 | $302,700 | $62,500 | $240,200 |
| 2016 | $8,554 | $302,700 | $62,500 | $240,200 |
| 2015 | -- | $302,700 | $62,500 | $240,200 |
| 2014 | -- | $302,700 | $62,500 | $240,200 |
Source: Public Records
Map
Nearby Homes