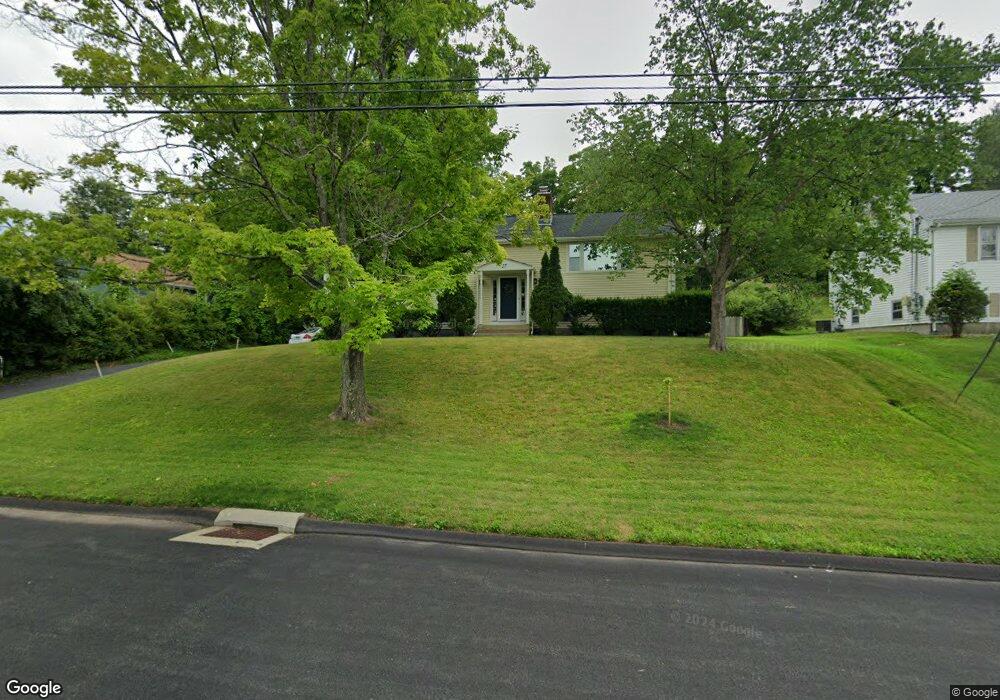
27 Downing Cir Bloomfield, CT 06002
Estimated Value: $343,000 - $388,199
3
Beds
3
Baths
1,398
Sq Ft
$261/Sq Ft
Est. Value
About This Home
This home is located at 27 Downing Cir, Bloomfield, CT 06002 and is currently estimated at $365,050, approximately $261 per square foot. 27 Downing Cir is a home located in Hartford County with nearby schools including Laurel School, Carmen Arace Intermediate School, and Metacomet School.
Ownership History
Date
Name
Owned For
Owner Type
Purchase Details
Closed on
Apr 25, 2023
Sold by
Hadden Lee and Hadden Alexandra
Bought by
Hadden Family Rev T and Hadden
Current Estimated Value
Purchase Details
Closed on
Dec 18, 2017
Sold by
Blumenfeld John F Jr E and Blumenfeld B
Bought by
Hadden Lee S and Haddem Alexandra C
Home Financials for this Owner
Home Financials are based on the most recent Mortgage that was taken out on this home.
Original Mortgage
$167,475
Interest Rate
3.94%
Mortgage Type
FHA
Purchase Details
Closed on
Feb 23, 1990
Sold by
Groce Charles
Bought by
Blumenfeld John
Purchase Details
Closed on
Sep 16, 1987
Sold by
Tower Joint Venture
Bought by
Benjamin Wayne
Home Financials for this Owner
Home Financials are based on the most recent Mortgage that was taken out on this home.
Original Mortgage
$126,500
Interest Rate
10.35%
Mortgage Type
Purchase Money Mortgage
Create a Home Valuation Report for This Property
The Home Valuation Report is an in-depth analysis detailing your home's value as well as a comparison with similar homes in the area
Home Values in the Area
Average Home Value in this Area
Purchase History
| Date | Buyer | Sale Price | Title Company |
|---|---|---|---|
| Hadden Family Rev T | -- | None Available | |
| Hadden Family Rev T | -- | None Available | |
| Hadden Lee S | $175,000 | -- | |
| Hadden Lee S | $175,000 | -- | |
| Blumenfeld John | $140,000 | -- | |
| Benjamin Wayne | $126,000 | -- |
Source: Public Records
Mortgage History
| Date | Status | Borrower | Loan Amount |
|---|---|---|---|
| Previous Owner | Benjamin Wayne | $167,475 | |
| Previous Owner | Benjamin Wayne | $126,500 |
Source: Public Records
Tax History
| Year | Tax Paid | Tax Assessment Tax Assessment Total Assessment is a certain percentage of the fair market value that is determined by local assessors to be the total taxable value of land and additions on the property. | Land | Improvement |
|---|---|---|---|---|
| 2025 | $8,707 | $232,190 | $52,080 | $180,110 |
| 2024 | $6,024 | $153,510 | $43,680 | $109,830 |
| 2023 | $5,915 | $153,510 | $43,680 | $109,830 |
| 2022 | $5,531 | $153,510 | $43,680 | $109,830 |
| 2021 | $5,654 | $153,510 | $43,680 | $109,830 |
| 2020 | $5,566 | $153,510 | $43,680 | $109,830 |
| 2019 | $5,886 | $152,250 | $43,680 | $108,570 |
| 2018 | $4,763 | $123,340 | $42,770 | $80,570 |
| 2017 | $4,756 | $123,340 | $42,770 | $80,570 |
| 2016 | $4,644 | $123,340 | $42,770 | $80,570 |
| 2015 | $4,557 | $123,340 | $42,770 | $80,570 |
| 2014 | $5,301 | $148,330 | $52,500 | $95,830 |
Source: Public Records
Map
Nearby Homes
- 81 Silo Way Unit 81
- 13 Hill Farm Rd
- 170 Thistle Pond Dr Unit 170
- 162 Thistle Pond Dr
- 79 Prospect St
- 26 Burnwood Dr
- 12 Filley St
- 99 Oliver Way Unit 99
- 200 Castlewood Dr
- 234 Woodland Ave
- 36 Gale Rd
- 63 Duncaster Rd
- 49 Tyler St
- 406 Tunxis Ave
- 256 Park Ave
- 159 School St
- 2 Camelot Dr Unit 4
- 545 Simsbury Rd
- 322 Tunxis Ave
- 31 Sutton Place
- 29 Downing Cir
- 25 Downing Cir
- 26 Downing Cir
- 23 Downing Cir
- 28 Downing Cir
- 31 Downing Cir
- 24 Downing Cir
- 30 Downing Cir
- 21 Downing Cir
- 33 Downing Cir
- 22 Downing Cir
- 32 Downing Cir
- 19 Downing Cir
- 55 Tunxis Ave Unit 115
- 55 Tunxis Ave Unit 106
- 55 Tunxis Ave Unit 139
- 55 Tunxis Ave Unit 137
- 55 Tunxis Ave
- 20 Downing Cir
- 81 Tunxis Ave
Your Personal Tour Guide
Ask me questions while you tour the home.