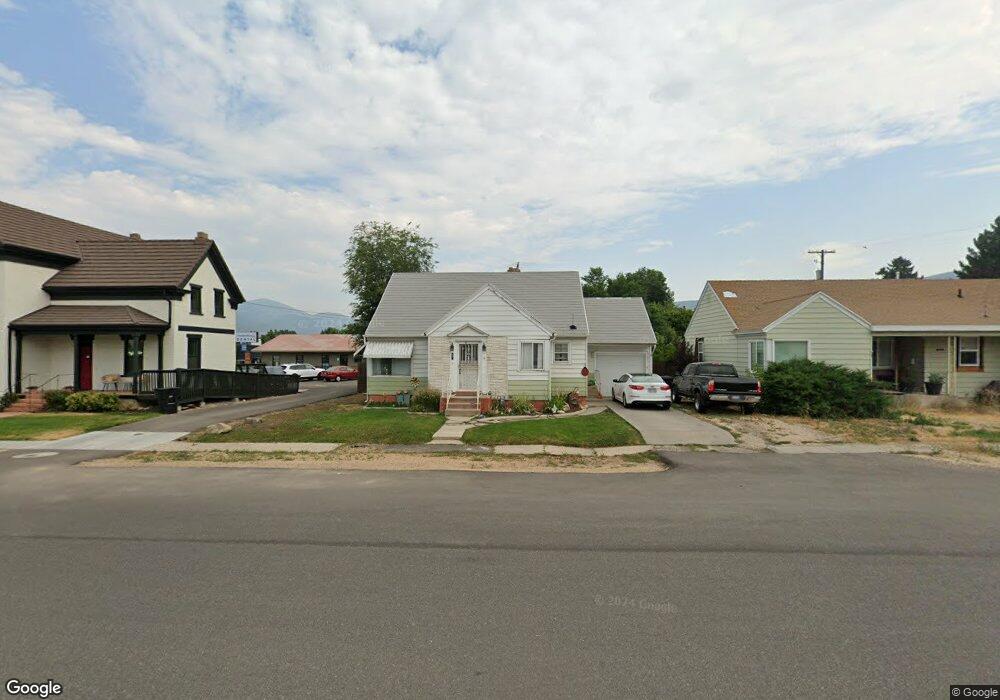
27 E 300 N Heber City, UT 84032
Estimated Value: $466,000 - $511,000
2
Beds
1
Bath
1,982
Sq Ft
$252/Sq Ft
Est. Value
About This Home
This home is located at 27 E 300 N, Heber City, UT 84032 and is currently estimated at $499,255, approximately $251 per square foot. 27 E 300 N is a home located in Wasatch County with nearby schools including J.R. Smith Elementary School and Wasatch High School.
Ownership History
Date
Name
Owned For
Owner Type
Purchase Details
Closed on
Mar 30, 2011
Sold by
Fannie Mae
Bought by
Gurule Heidi
Current Estimated Value
Home Financials for this Owner
Home Financials are based on the most recent Mortgage that was taken out on this home.
Original Mortgage
$104,663
Outstanding Balance
$72,746
Interest Rate
4.96%
Mortgage Type
New Conventional
Estimated Equity
$426,509
Purchase Details
Closed on
Jul 21, 2010
Sold by
Peterson Shane
Bought by
Federal National Mortgage Association
Purchase Details
Closed on
Nov 11, 2005
Sold by
Peterson Vernon J
Bought by
Peterson Shane
Home Financials for this Owner
Home Financials are based on the most recent Mortgage that was taken out on this home.
Original Mortgage
$112,730
Interest Rate
6.07%
Mortgage Type
FHA
Create a Home Valuation Report for This Property
The Home Valuation Report is an in-depth analysis detailing your home's value as well as a comparison with similar homes in the area
Home Values in the Area
Average Home Value in this Area
Purchase History
| Date | Buyer | Sale Price | Title Company |
|---|---|---|---|
| Gurule Heidi | -- | Empire Land Title Inc | |
| Federal National Mortgage Association | $168,242 | Etitle Insurance Agency | |
| Peterson Shane | -- | Guardian Title Co Of Utah |
Source: Public Records
Mortgage History
| Date | Status | Borrower | Loan Amount |
|---|---|---|---|
| Open | Gurule Heidi | $104,663 | |
| Previous Owner | Peterson Shane | $112,730 |
Source: Public Records
Tax History
| Year | Tax Paid | Tax Assessment Tax Assessment Total Assessment is a certain percentage of the fair market value that is determined by local assessors to be the total taxable value of land and additions on the property. | Land | Improvement |
|---|---|---|---|---|
| 2025 | $2,423 | $472,961 | $200,000 | $272,961 |
| 2024 | $2,330 | $457,920 | $200,000 | $257,920 |
| 2023 | $2,330 | $505,928 | $125,000 | $380,928 |
| 2022 | $2,815 | $505,928 | $125,000 | $380,928 |
| 2021 | $2,636 | $376,378 | $150,000 | $226,378 |
| 2020 | $2,207 | $306,846 | $115,000 | $191,846 |
| 2019 | $1,921 | $155,015 | $0 | $0 |
| 2018 | $1,498 | $120,930 | $0 | $0 |
| 2017 | $1,332 | $106,890 | $0 | $0 |
| 2016 | $1,200 | $93,822 | $0 | $0 |
| 2015 | $975 | $79,859 | $0 | $0 |
| 2014 | $983 | $79,859 | $0 | $0 |
Source: Public Records
Map
Nearby Homes
Your Personal Tour Guide
Ask me questions while you tour the home.