Estimated Value: $330,000 - $424,000
3
Beds
1
Bath
1,067
Sq Ft
$353/Sq Ft
Est. Value
About This Home
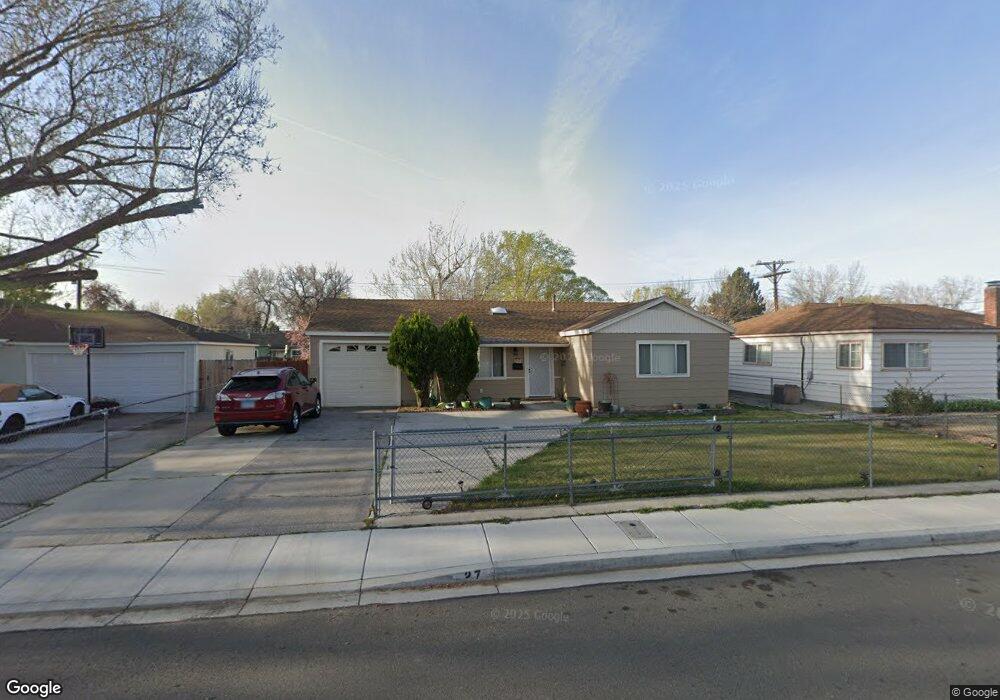
This home is located at 27 E L St, Sparks, NV 89431 and is currently estimated at $376,393, approximately $352 per square foot. 27 E L St is a home located in Washoe County with nearby schools including Greenbrae Elementary School, George L Dilworth Middle School, and Sparks High School.
Ownership History
Date
Name
Owned For
Owner Type
Purchase Details
Closed on
Dec 4, 2024
Sold by
Parra Alicia A and Parra Maximiliano
Bought by
Parra Living Trust and Parra
Current Estimated Value
Purchase Details
Closed on
Sep 30, 1994
Sold by
Olsen Ronald Kevin
Bought by
Parra Maximiliano and Parra Alicia A
Home Financials for this Owner
Home Financials are based on the most recent Mortgage that was taken out on this home.
Original Mortgage
$81,800
Interest Rate
8.58%
Mortgage Type
FHA
Create a Home Valuation Report for This Property
The Home Valuation Report is an in-depth analysis detailing your home's value as well as a comparison with similar homes in the area
Home Values in the Area
Average Home Value in this Area
Purchase History
| Date | Buyer | Sale Price | Title Company |
|---|---|---|---|
| Parra Living Trust | -- | None Listed On Document | |
| Parra Maximiliano | $90,000 | -- |
Source: Public Records
Mortgage History
| Date | Status | Borrower | Loan Amount |
|---|---|---|---|
| Previous Owner | Parra Maximiliano | $81,800 |
Source: Public Records
Tax History
| Year | Tax Paid | Tax Assessment Tax Assessment Total Assessment is a certain percentage of the fair market value that is determined by local assessors to be the total taxable value of land and additions on the property. | Land | Improvement |
|---|---|---|---|---|
| 2026 | $679 | $50,404 | $34,090 | $16,314 |
| 2025 | $846 | $49,749 | $33,565 | $16,184 |
| 2024 | $783 | $46,054 | $30,065 | $15,989 |
| 2023 | $783 | $46,100 | $31,325 | $14,775 |
| 2022 | $726 | $38,192 | $26,180 | $12,012 |
| 2021 | $674 | $29,689 | $17,955 | $11,734 |
| 2020 | $632 | $28,456 | $16,940 | $11,516 |
| 2019 | $602 | $26,889 | $15,890 | $10,999 |
| 2018 | $576 | $22,276 | $11,725 | $10,551 |
| 2017 | $553 | $20,784 | $10,395 | $10,389 |
| 2016 | $544 | $19,717 | $9,345 | $10,372 |
| 2015 | $545 | $17,872 | $7,700 | $10,172 |
| 2014 | $528 | $16,185 | $6,440 | $9,745 |
| 2013 | -- | $13,810 | $4,270 | $9,540 |
Source: Public Records
Map
Nearby Homes
Your Personal Tour Guide
Ask me questions while you tour the home.