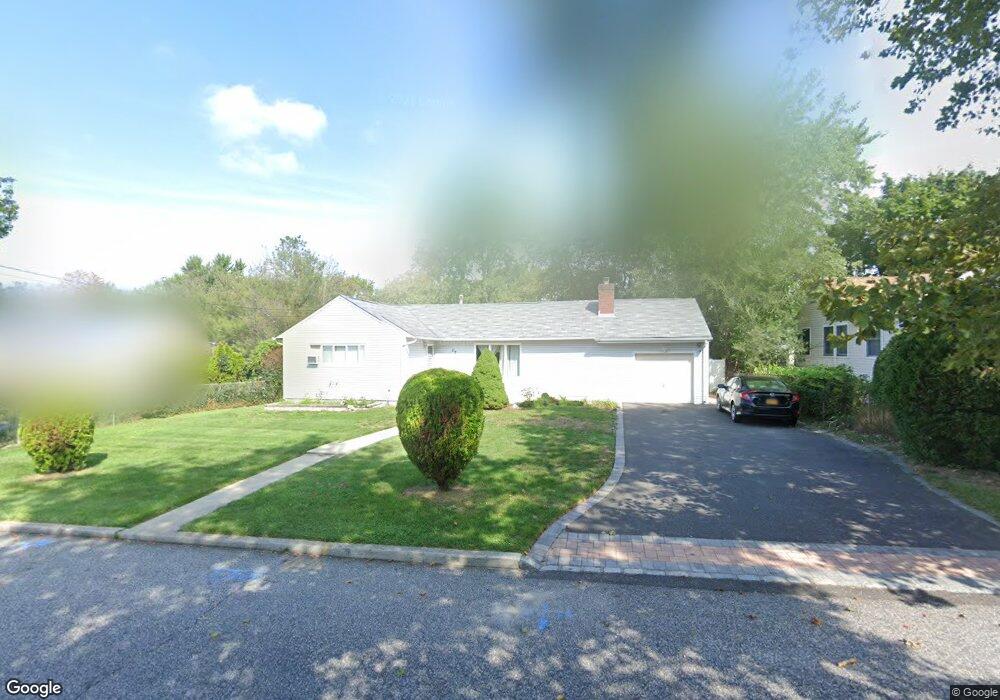
27 E Maple St Central Islip, NY 11722
Estimated Value: $522,000 - $546,626
3
Beds
2
Baths
--
Sq Ft
7,405
Sq Ft Lot
About This Home
This home is located at 27 E Maple St, Central Islip, NY 11722 and is currently estimated at $535,907. 27 E Maple St is a home located in Suffolk County with nearby schools including Anthony Alfano Elementary School and Central Islip Senior High School.
Ownership History
Date
Name
Owned For
Owner Type
Purchase Details
Closed on
Aug 28, 2002
Sold by
Polizois Spiro
Bought by
Granados Carlos and Granados George
Current Estimated Value
Home Financials for this Owner
Home Financials are based on the most recent Mortgage that was taken out on this home.
Original Mortgage
$213,300
Outstanding Balance
$89,883
Interest Rate
6.36%
Mortgage Type
FHA
Estimated Equity
$446,024
Purchase Details
Closed on
Apr 26, 2002
Sold by
Denny Henry and Denny Barbara
Bought by
Polizois Spiro S
Create a Home Valuation Report for This Property
The Home Valuation Report is an in-depth analysis detailing your home's value as well as a comparison with similar homes in the area
Home Values in the Area
Average Home Value in this Area
Purchase History
| Date | Buyer | Sale Price | Title Company |
|---|---|---|---|
| Granados Carlos | $215,000 | First American Title | |
| Polizois Spiro S | $110,000 | -- |
Source: Public Records
Mortgage History
| Date | Status | Borrower | Loan Amount |
|---|---|---|---|
| Open | Granados Carlos | $213,300 |
Source: Public Records
Tax History
| Year | Tax Paid | Tax Assessment Tax Assessment Total Assessment is a certain percentage of the fair market value that is determined by local assessors to be the total taxable value of land and additions on the property. | Land | Improvement |
|---|---|---|---|---|
| 2024 | $8,206 | $29,000 | $5,600 | $23,400 |
| 2023 | $8,206 | $29,000 | $5,600 | $23,400 |
| 2022 | $7,315 | $29,000 | $5,600 | $23,400 |
| 2021 | $7,315 | $29,000 | $5,600 | $23,400 |
| 2020 | $7,798 | $29,000 | $5,600 | $23,400 |
| 2019 | $7,798 | $0 | $0 | $0 |
| 2018 | -- | $29,000 | $5,600 | $23,400 |
| 2017 | $7,402 | $29,000 | $5,600 | $23,400 |
| 2016 | $7,342 | $29,000 | $5,600 | $23,400 |
| 2015 | -- | $29,000 | $5,600 | $23,400 |
| 2014 | -- | $29,000 | $5,600 | $23,400 |
Source: Public Records
Map
Nearby Homes
- 37 E Maple St
- 28 Hemlock St
- 0 Poplar St
- 13 Poplar St
- 39 E Walnut St
- 21 E Walnut St
- 14 E Walnut St
- 16 E Chestnut St
- 169 Dovecote Ln
- 39 2nd Place
- 1150 Connetquot Ave
- 27 Ash St
- 1151 Connetquot Ave
- 138 Weatherby Ln Unit 138
- 151 Allwood Ave
- 33 E Cherry St
- 37 Weatherby Ln
- 11 Hunter Dr
- 410 Elmore St
- 40 E Cherry St
Your Personal Tour Guide
Ask me questions while you tour the home.