27 E Red Bridge Ln South Hadley, MA 01075
Estimated Value: $592,000 - $695,000
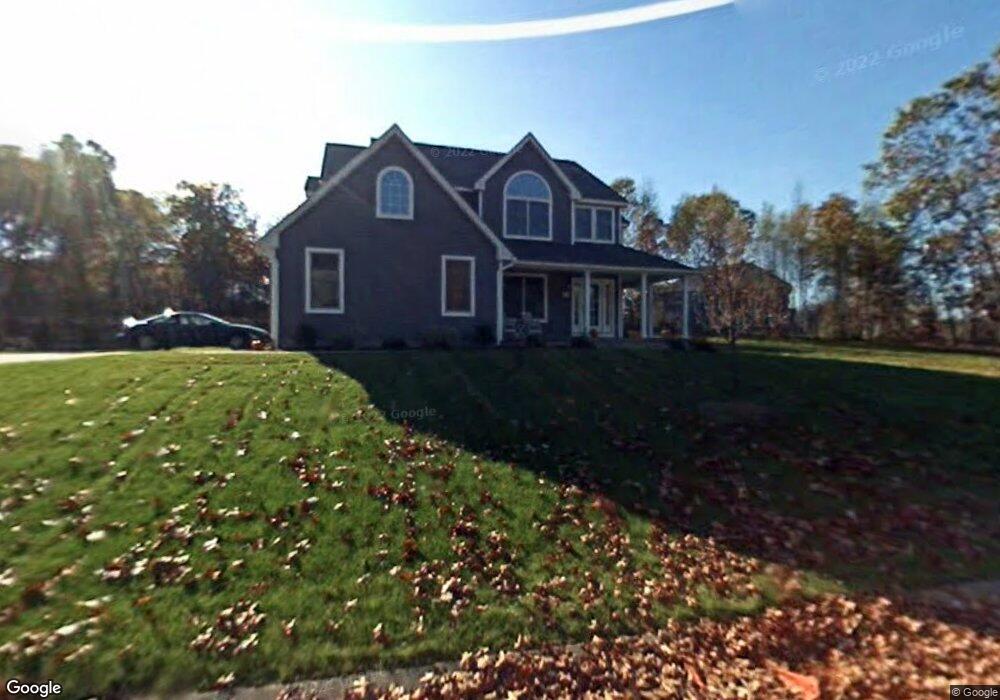
About This Home
This home is located at 27 E Red Bridge Ln, South Hadley, MA 01075 and is currently estimated at $657,586, approximately $410 per square foot. 27 E Red Bridge Ln is a home located in Hampshire County with nearby schools including Plains Elementary School, Mosier Elementary School, and Michael E. Smith Middle School.
Ownership History
We collect this data history from publicly available records. To have your information removed, we recommend requesting removal directly through your county’s website.
Purchase Details
Home Financials for this Owner
Home Financials are based on the most recent Mortgage that was taken out on this home.Home Values in the Area
Average Home Value in this Area
Purchase History
We collect this data history from publicly available records. To have your information removed, we recommend requesting removal directly through your county’s website.
| Date | Buyer | Sale Price | Title Company |
|---|---|---|---|
| $150,000 | -- |
Mortgage History
We collect this data history from publicly available records. To have your information removed, we recommend requesting removal directly through your county’s website.
| Date | Status | Borrower | Loan Amount |
|---|---|---|---|
| Open | $50,000 | ||
| Open | $276,500 | ||
| Closed | $320,866 |
Tax History
We collect this data history from publicly available records. To have your information removed, we recommend requesting removal directly through your county’s website.
| Year | Tax Paid | Tax Assessment Tax Assessment Total Assessment is a certain percentage of the fair market value that is determined by local assessors to be the total taxable value of land and additions on the property. | Land | Improvement |
|---|---|---|---|---|
| 2025 | $9,856 | $608,000 | $145,600 | $462,400 |
| 2024 | $9,722 | $586,000 | $136,000 | $450,000 |
| 2023 | $9,603 | $540,400 | $123,800 | $416,600 |
| 2022 | $9,177 | $483,500 | $123,800 | $359,700 |
| 2021 | $8,975 | $453,300 | $115,700 | $337,600 |
| 2020 | $8,510 | $418,400 | $115,700 | $302,700 |
| 2019 | $8,748 | $425,700 | $125,800 | $299,900 |
| 2018 | $8,446 | $413,600 | $122,000 | $291,600 |
| 2017 | $8,103 | $392,200 | $122,000 | $270,200 |
| 2016 | $8,114 | $396,000 | $122,800 | $273,200 |
| 2015 | $7,794 | $384,700 | $119,300 | $265,400 |
Map
- 5 Red Bridge Ln
- 16 Saybrook Cir
- 12 Blueberry Bend
- 35 Charon Terrace
- Lot A East St
- 540 Granby Rd Unit 67
- 5 Helm St
- 3 Mary Lyon Dr
- 72 Park St
- 124 College St Unit 2
- 170 Stonybrook Way Unit 170
- 109 College St
- 10 Benger Ave
- 4 Skyline Dr
- 12 Karen Dr
- 35 Queen Cir
- 34 Leahey Ave
- 40 Pittroff Ave
- 31 Lexington Ave
- 62 Lincoln Ave
- 28 Red Bridge Ln
- 32 Red Bridge Ln
- 32 Red Bridge Ln
- 32 Red Bridge Ln
- 39 Red Bridge Ln
- 27 E Red Bridge Ln
- 25 Red Bridge Ln
- 23 Red Bridge Ln
- 25 Red Bridge Ln Unit LOT40
- 25 Red Bridge Ln
- 29 Red Bridge Ln
- 21 Red Bridge Ln
- 31 E Red Bridge Ln
- 31 E Red Bridge Ln
- 17 Red Bridge Ln
- 33 Red Bridge Ln
- 22 E Red Bridge Ln
- 22 E Red Bridge Ln
- 35 E Red Bridge Ln
- 18 E Red Bridge Ln
Ask me questions while you tour the home.