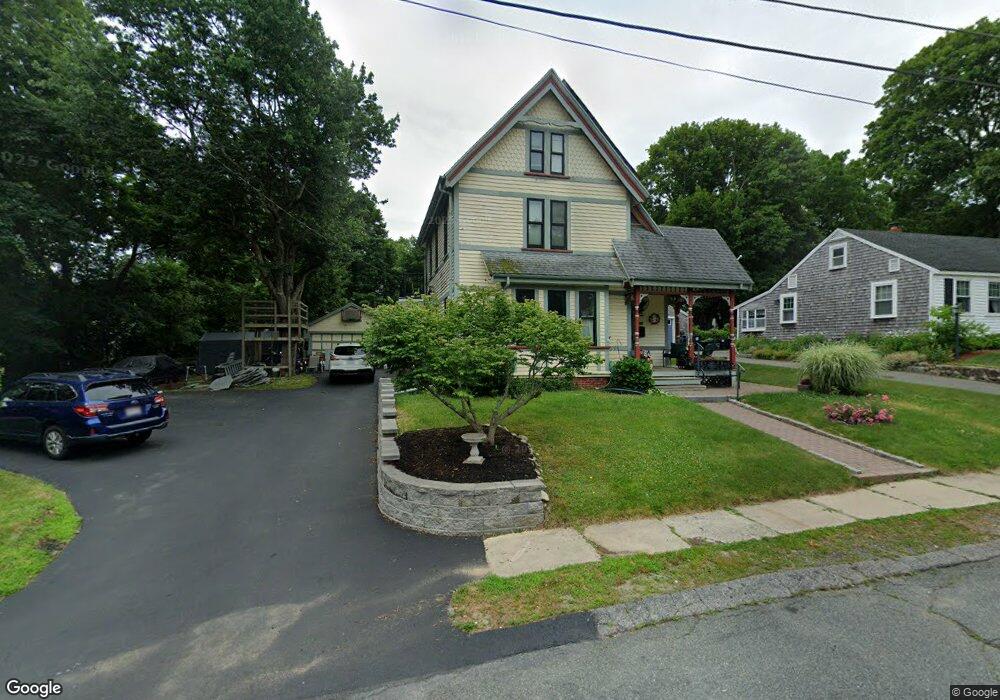
27 Ellis Ave Whitman, MA 02382
Estimated Value: $587,602 - $661,000
3
Beds
3
Baths
1,892
Sq Ft
$321/Sq Ft
Est. Value
About This Home
This home is located at 27 Ellis Ave, Whitman, MA 02382 and is currently estimated at $607,401, approximately $321 per square foot. 27 Ellis Ave is a home located in Plymouth County with nearby schools including St Bridget School.
Ownership History
Date
Name
Owned For
Owner Type
Purchase Details
Closed on
Dec 22, 2016
Sold by
Powers Anne-Marie and Martin Peter
Bought by
Martin-Powers Joint Re
Current Estimated Value
Purchase Details
Closed on
Jun 28, 1999
Sold by
Hurley Robert D and Hurley Nancy L
Bought by
Powers Ann M and Martin Peter
Purchase Details
Closed on
Oct 15, 1987
Sold by
Mackenzie Andrews M
Bought by
Hurley Robert D
Create a Home Valuation Report for This Property
The Home Valuation Report is an in-depth analysis detailing your home's value as well as a comparison with similar homes in the area
Home Values in the Area
Average Home Value in this Area
Purchase History
| Date | Buyer | Sale Price | Title Company |
|---|---|---|---|
| Martin-Powers Joint Re | -- | -- | |
| Powers Ann M | $144,900 | -- | |
| Hurley Robert D | $142,000 | -- |
Source: Public Records
Mortgage History
| Date | Status | Borrower | Loan Amount |
|---|---|---|---|
| Previous Owner | Hurley Robert D | $30,000 | |
| Previous Owner | Hurley Robert D | $232,000 | |
| Previous Owner | Hurley Robert D | $196,500 |
Source: Public Records
Tax History
| Year | Tax Paid | Tax Assessment Tax Assessment Total Assessment is a certain percentage of the fair market value that is determined by local assessors to be the total taxable value of land and additions on the property. | Land | Improvement |
|---|---|---|---|---|
| 2025 | $6,982 | $532,200 | $216,600 | $315,600 |
| 2024 | $6,459 | $507,000 | $212,400 | $294,600 |
| 2023 | $6,165 | $454,300 | $184,100 | $270,200 |
| 2022 | $6,104 | $419,200 | $167,400 | $251,800 |
| 2021 | $5,890 | $380,000 | $153,800 | $226,200 |
| 2020 | $5,676 | $358,100 | $139,200 | $218,900 |
| 2019 | $5,337 | $347,000 | $139,200 | $207,800 |
| 2018 | $4,561 | $310,400 | $131,800 | $178,600 |
| 2017 | $4,527 | $300,200 | $131,800 | $168,400 |
| 2016 | $4,396 | $282,000 | $125,600 | $156,400 |
| 2015 | $4,496 | $288,000 | $125,600 | $162,400 |
Source: Public Records
Map
Nearby Homes
Your Personal Tour Guide
Ask me questions while you tour the home.