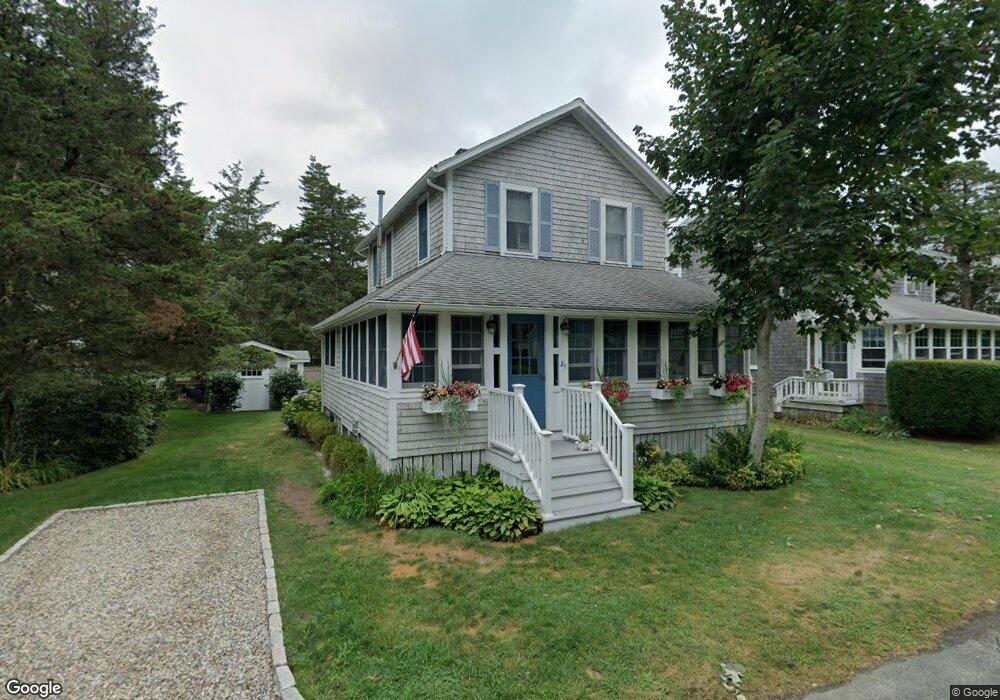
27 Fairview Rd Pocasset, MA 2559
Pocasset NeighborhoodEstimated Value: $709,000 - $862,000
3
Beds
1
Bath
1,408
Sq Ft
$553/Sq Ft
Est. Value
About This Home
This home is located at 27 Fairview Rd, Pocasset, MA 2559 and is currently estimated at $778,306, approximately $552 per square foot. 27 Fairview Rd is a home located in Barnstable County with nearby schools including Bourne High School and Cadence Academy Preschool - Bourne.
Ownership History
Date
Name
Owned For
Owner Type
Purchase Details
Closed on
Aug 6, 2012
Sold by
Sandberg Jon L and Sandberg Deborah T
Bought by
Orne Leslie S and Sandberg Timothy F
Current Estimated Value
Purchase Details
Closed on
Aug 31, 1989
Sold by
Raymond Randy
Bought by
Raymond Ronald J
Home Financials for this Owner
Home Financials are based on the most recent Mortgage that was taken out on this home.
Original Mortgage
$100,000
Interest Rate
9.7%
Mortgage Type
Purchase Money Mortgage
Create a Home Valuation Report for This Property
The Home Valuation Report is an in-depth analysis detailing your home's value as well as a comparison with similar homes in the area
Home Values in the Area
Average Home Value in this Area
Purchase History
We collect this data history from publicly available records. To have your information removed, we recommend requesting removal directly through your county’s website.
| Date | Buyer | Sale Price | Title Company |
|---|---|---|---|
| Orne Leslie S | -- | -- | |
| Orne Leslie S | -- | -- | |
| Raymond Ronald J | $82,500 | -- | |
| Raymond Ronald J | $82,500 | -- |
Source: Public Records
Mortgage History
We collect this data history from publicly available records. To have your information removed, we recommend requesting removal directly through your county’s website.
| Date | Status | Borrower | Loan Amount |
|---|---|---|---|
| Previous Owner | Raymond Ronald J | $100,000 |
Source: Public Records
Tax History
| Year | Tax Paid | Tax Assessment Tax Assessment Total Assessment is a certain percentage of the fair market value that is determined by local assessors to be the total taxable value of land and additions on the property. | Land | Improvement |
|---|---|---|---|---|
| 2025 | $5,507 | $705,100 | $420,000 | $285,100 |
| 2024 | $4,798 | $598,200 | $400,000 | $198,200 |
| 2023 | $4,290 | $487,000 | $311,500 | $175,500 |
| 2022 | $3,873 | $383,800 | $244,300 | $139,500 |
| 2021 | $3,765 | $349,600 | $222,400 | $127,200 |
| 2020 | $3,600 | $335,200 | $220,200 | $115,000 |
| 2019 | $3,456 | $328,800 | $220,200 | $108,600 |
| 2018 | $3,360 | $318,800 | $215,200 | $103,600 |
| 2017 | $3,471 | $337,000 | $234,400 | $102,600 |
| 2016 | $3,159 | $310,900 | $213,100 | $97,800 |
| 2015 | $3,131 | $310,900 | $213,100 | $97,800 |
Source: Public Records
Map
Nearby Homes
- 14 Navajo Rd
- 265 Wings Neck Rd
- 254 Barlows Landing Rd
- 4 Quail Hill Rd
- 566 Shore Rd
- 551 Shore Rd
- 174 Barlows Landing Rd
- 52 Club House Dr
- 23 Club House Dr
- 3 1st St
- 1 2nd Ave Unit 1
- 3 4th Ave
- 1090 Shore Rd Unit 7
- 22 Avery Rd
- 10 Howard Ave
- 3 Melville Ct Unit C
- 21 Clay Pond Rd
- 47 Cliff Rd
- 461 Wings Neck Rd
- 1 Hawthorne Ct Unit C
Your Personal Tour Guide
Ask me questions while you tour the home.