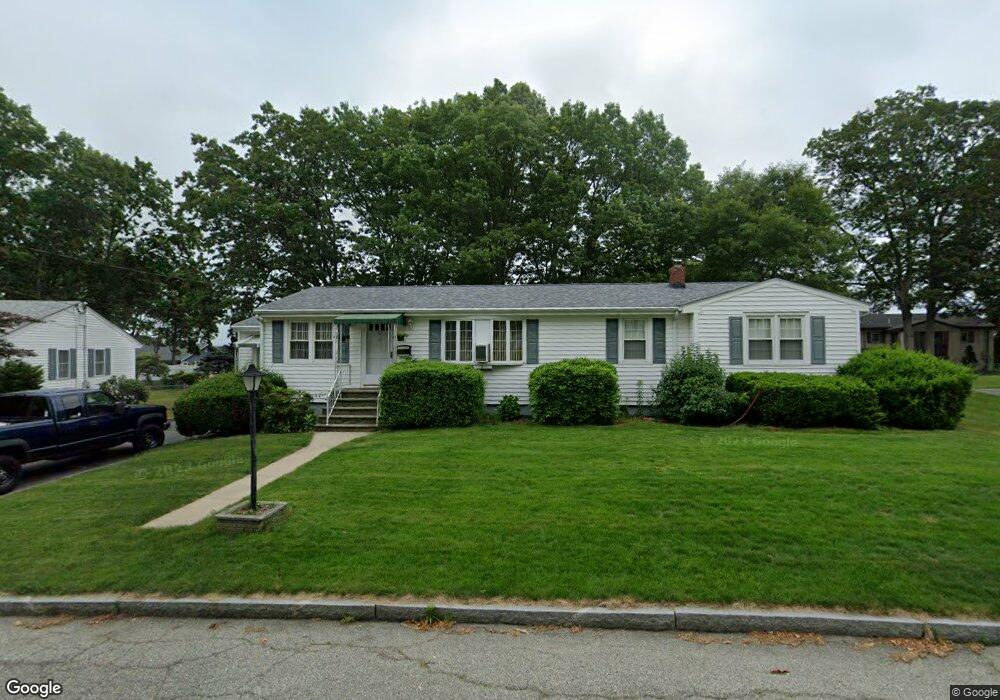
27 Fenmore St Fall River, MA 02723
Bank Street NeighborhoodEstimated Value: $418,000 - $472,000
3
Beds
2
Baths
1,420
Sq Ft
$314/Sq Ft
Est. Value
About This Home
This home is located at 27 Fenmore St, Fall River, MA 02723 and is currently estimated at $445,270, approximately $313 per square foot. 27 Fenmore St is a home located in Bristol County with nearby schools including Mary Fonseca Elementary School, Talbot Innovation School, and B M C Durfee High School.
Ownership History
Date
Name
Owned For
Owner Type
Purchase Details
Closed on
May 27, 2014
Sold by
Picard Gertrude
Bought by
Picard Ronald
Current Estimated Value
Home Financials for this Owner
Home Financials are based on the most recent Mortgage that was taken out on this home.
Original Mortgage
$170,950
Outstanding Balance
$127,990
Interest Rate
4.33%
Mortgage Type
New Conventional
Estimated Equity
$317,280
Purchase Details
Closed on
Dec 10, 2007
Sold by
Belanger Christine
Bought by
Picard Gertrude
Home Financials for this Owner
Home Financials are based on the most recent Mortgage that was taken out on this home.
Original Mortgage
$423,000
Interest Rate
6.37%
Mortgage Type
Purchase Money Mortgage
Purchase Details
Closed on
Mar 11, 2004
Sold by
Wayland Dev Corp
Bought by
Woodford 03 Rt and Mulford
Create a Home Valuation Report for This Property
The Home Valuation Report is an in-depth analysis detailing your home's value as well as a comparison with similar homes in the area
Home Values in the Area
Average Home Value in this Area
Purchase History
| Date | Buyer | Sale Price | Title Company |
|---|---|---|---|
| Picard Ronald W | $190,000 | -- | |
| Picard Gertrude | -- | -- | |
| Picard Gertrude | -- | -- | |
| Woodford 03 Rt | $80,000 | -- |
Source: Public Records
Mortgage History
| Date | Status | Borrower | Loan Amount |
|---|---|---|---|
| Open | Picard Ronald W | $170,950 | |
| Previous Owner | Picard Gertrude | $423,000 | |
| Previous Owner | Woodford 03 Rt | $92,000 | |
| Previous Owner | Woodford 03 Rt | $112,000 |
Source: Public Records
Tax History
| Year | Tax Paid | Tax Assessment Tax Assessment Total Assessment is a certain percentage of the fair market value that is determined by local assessors to be the total taxable value of land and additions on the property. | Land | Improvement |
|---|---|---|---|---|
| 2025 | $4,042 | $353,000 | $139,200 | $213,800 |
| 2024 | $3,786 | $329,500 | $133,800 | $195,700 |
| 2023 | $3,697 | $301,300 | $120,200 | $181,100 |
| 2022 | $3,267 | $258,900 | $111,200 | $147,700 |
| 2021 | $3,305 | $239,000 | $105,100 | $133,900 |
| 2020 | $3,193 | $221,000 | $101,100 | $119,900 |
| 2019 | $3,108 | $213,200 | $101,100 | $112,100 |
| 2018 | $3,000 | $205,200 | $101,100 | $104,100 |
| 2017 | $2,848 | $203,400 | $101,100 | $102,300 |
| 2016 | $2,704 | $198,400 | $101,100 | $97,300 |
| 2015 | $2,680 | $204,900 | $94,600 | $110,300 |
| 2014 | $2,578 | $204,900 | $94,600 | $110,300 |
Source: Public Records
Map
Nearby Homes
Your Personal Tour Guide
Ask me questions while you tour the home.