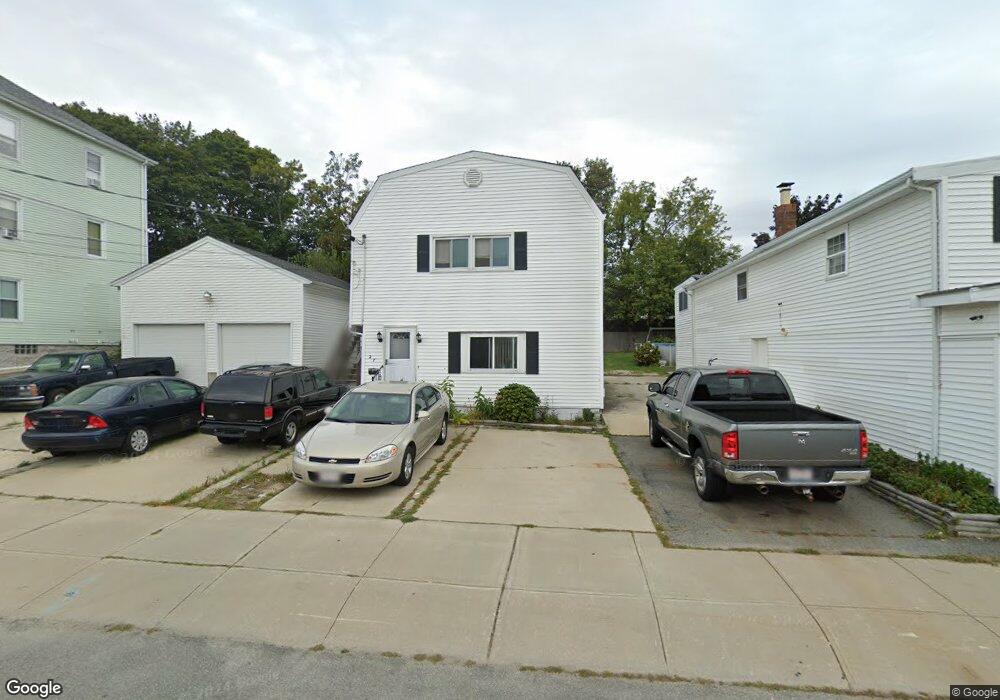
27 Fenner St Fall River, MA 02724
Father Kelly NeighborhoodEstimated Value: $443,000 - $458,000
3
Beds
2
Baths
1,840
Sq Ft
$245/Sq Ft
Est. Value
About This Home
This home is located at 27 Fenner St, Fall River, MA 02724 and is currently estimated at $450,286, approximately $244 per square foot. 27 Fenner St is a home located in Bristol County with nearby schools including Carlton M. Viveiros Elementary School, Matthew J. Kuss Middle School, and B M C Durfee High School.
Ownership History
Date
Name
Owned For
Owner Type
Purchase Details
Closed on
Aug 8, 2023
Sold by
Cooper Laurie A
Bought by
Cooper Lauric A and Cooper Andrew B
Current Estimated Value
Purchase Details
Closed on
May 28, 2010
Sold by
Cinquini Mary E and Gaudreau Ronald
Bought by
Cooper Laurie A
Purchase Details
Closed on
Oct 31, 2006
Sold by
Cinquini Mary E
Bought by
Cinquini Mary E and Gaudreau Ronald
Create a Home Valuation Report for This Property
The Home Valuation Report is an in-depth analysis detailing your home's value as well as a comparison with similar homes in the area
Home Values in the Area
Average Home Value in this Area
Purchase History
| Date | Buyer | Sale Price | Title Company |
|---|---|---|---|
| Cooper Lauric A | -- | None Available | |
| Cooper Laurie A | $174,000 | -- | |
| Cinquini Mary E | -- | -- |
Source: Public Records
Tax History
| Year | Tax Paid | Tax Assessment Tax Assessment Total Assessment is a certain percentage of the fair market value that is determined by local assessors to be the total taxable value of land and additions on the property. | Land | Improvement |
|---|---|---|---|---|
| 2025 | $3,822 | $333,800 | $114,400 | $219,400 |
| 2024 | $3,616 | $314,700 | $110,200 | $204,500 |
| 2023 | $3,669 | $299,000 | $91,000 | $208,000 |
| 2022 | $3,351 | $265,500 | $86,700 | $178,800 |
| 2021 | $3,354 | $242,500 | $82,500 | $160,000 |
| 2020 | $3,347 | $231,600 | $81,300 | $150,300 |
| 2019 | $3,262 | $223,700 | $78,300 | $145,400 |
| 2018 | $3,290 | $225,000 | $84,800 | $140,200 |
| 2017 | $3,067 | $219,100 | $80,800 | $138,300 |
| 2016 | $2,974 | $218,200 | $86,000 | $132,200 |
| 2015 | $2,935 | $224,400 | $86,000 | $138,400 |
| 2014 | $2,790 | $221,800 | $83,400 | $138,400 |
Source: Public Records
Map
Nearby Homes
- 1334 S Main St
- 917 Dwelly St
- 234 Kilburn St
- 344-354 E Main St
- 1273-1279 S Main St
- 20 Wilcox St
- 219 Montaup St
- 240 Montaup St
- 340 Vale St
- 71 Mystic St Unit 3
- 1846 S Main St
- 82 Montaup St
- 1852 S Main St
- 609 King Philip St
- 57 Larouche St
- 355 Peckham St
- 15 Higgins St
- 464 Birch St
- 250 Laurel St
- 119 Pebble St
- 17 Fenner St
- 17 Fenner St
- 39 Fenner St
- 64 Kilburn St
- 72 Kilburn St
- 53 Fenner St
- 86 Kilburn St Unit 2N
- 86 Kilburn St
- 629 Globe St
- 629 Globe St Unit 2
- 625 Globe St
- 625 Globe St Unit 1
- 61 Fenner St
- 26 Kilburn St
- 42 Kilburn St Unit 2
- 34 Kilburn St Unit B1
- 34 Kilburn St
- 34-42 Kilburn St
- 96 Kilburn St
- 870 Slade St
Your Personal Tour Guide
Ask me questions while you tour the home.