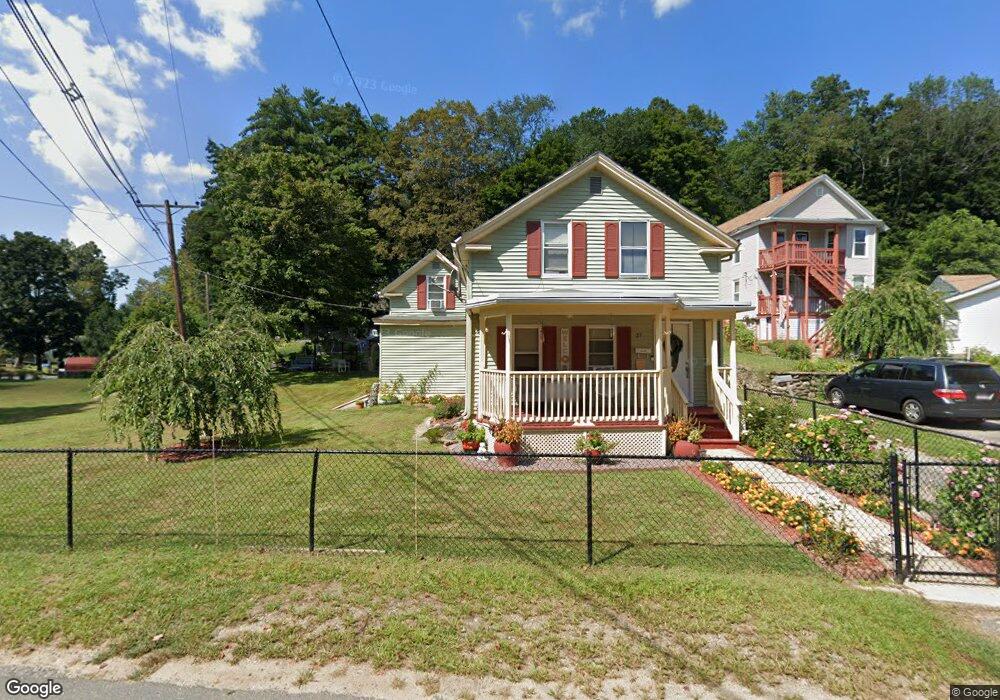
27 Fiske St Southbridge, MA 01550
Estimated Value: $324,000 - $368,556
4
Beds
2
Baths
1,612
Sq Ft
$210/Sq Ft
Est. Value
About This Home
This home is located at 27 Fiske St, Southbridge, MA 01550 and is currently estimated at $338,639, approximately $210 per square foot. 27 Fiske St is a home located in Worcester County with nearby schools including Trinity Catholic Academy.
Ownership History
Date
Name
Owned For
Owner Type
Purchase Details
Closed on
Feb 28, 2011
Sold by
Fhlmc
Bought by
Aponte Carmen L
Current Estimated Value
Purchase Details
Closed on
Jul 29, 2010
Sold by
Suarez Juan and One West Bk
Bought by
Fhlmc
Purchase Details
Closed on
Nov 21, 1996
Sold by
First Natl Bk Boston
Bought by
Suarez Juan and Lopez Maria
Home Financials for this Owner
Home Financials are based on the most recent Mortgage that was taken out on this home.
Original Mortgage
$41,040
Interest Rate
7.81%
Mortgage Type
Purchase Money Mortgage
Purchase Details
Closed on
Jul 20, 1995
Sold by
Perrin Marvin
Bought by
First Nb Boston
Create a Home Valuation Report for This Property
The Home Valuation Report is an in-depth analysis detailing your home's value as well as a comparison with similar homes in the area
Home Values in the Area
Average Home Value in this Area
Purchase History
| Date | Buyer | Sale Price | Title Company |
|---|---|---|---|
| Aponte Carmen L | $79,000 | -- | |
| Aponte Carmen L | $79,000 | -- | |
| Fhlmc | $85,750 | -- | |
| Fhlmc | $85,750 | -- | |
| Suarez Juan | $51,300 | -- | |
| Suarez Juan | $51,300 | -- | |
| First Nb Boston | $31,671 | -- | |
| First Nb Boston | $31,671 | -- |
Source: Public Records
Mortgage History
| Date | Status | Borrower | Loan Amount |
|---|---|---|---|
| Previous Owner | First Nb Boston | $55,000 | |
| Previous Owner | First Nb Boston | $54,000 | |
| Previous Owner | First Nb Boston | $41,040 |
Source: Public Records
Tax History Compared to Growth
Tax History
| Year | Tax Paid | Tax Assessment Tax Assessment Total Assessment is a certain percentage of the fair market value that is determined by local assessors to be the total taxable value of land and additions on the property. | Land | Improvement |
|---|---|---|---|---|
| 2025 | $4,188 | $285,700 | $37,300 | $248,400 |
| 2024 | $4,174 | $273,500 | $18,600 | $254,900 |
| 2023 | $3,924 | $247,700 | $18,600 | $229,100 |
| 2022 | $3,705 | $207,000 | $15,900 | $191,100 |
| 2021 | $3,552 | $182,700 | $15,900 | $166,800 |
| 2020 | $3,204 | $164,500 | $15,900 | $148,600 |
| 2018 | $3,181 | $153,300 | $23,000 | $130,300 |
| 2017 | $2,847 | $138,400 | $23,000 | $115,400 |
| 2016 | $2,854 | $141,200 | $23,000 | $118,200 |
| 2015 | $2,738 | $134,500 | $24,800 | $109,700 |
| 2014 | $2,809 | $143,000 | $24,800 | $118,200 |
Source: Public Records
Map
Nearby Homes