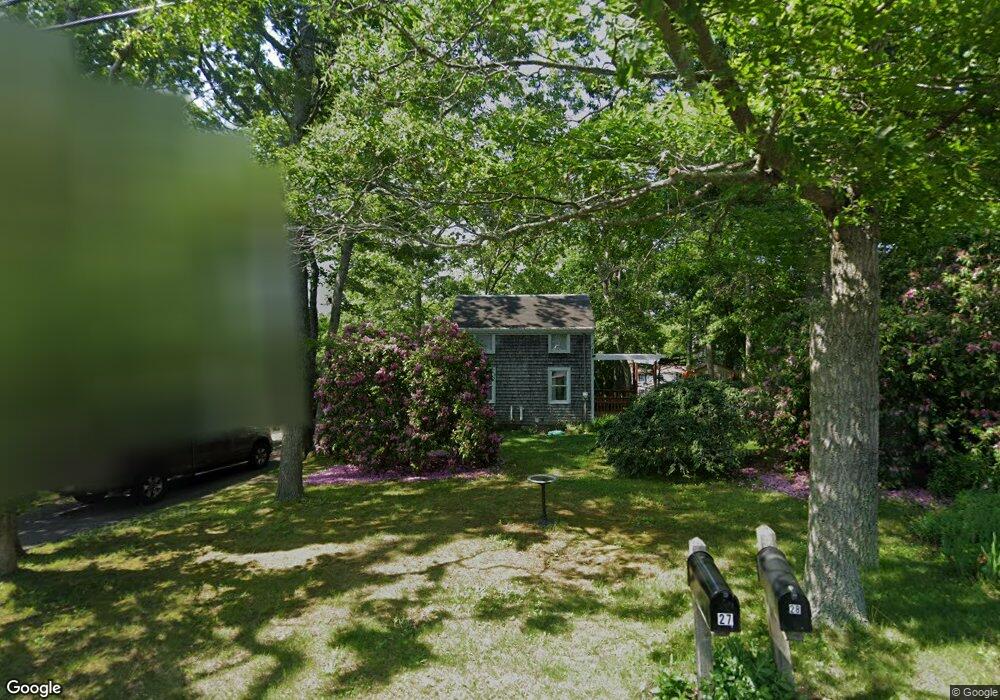
27 Florence St Plymouth, MA 02360
Estimated Value: $447,311 - $620,000
2
Beds
2
Baths
893
Sq Ft
$567/Sq Ft
Est. Value
About This Home
This home is located at 27 Florence St, Plymouth, MA 02360 and is currently estimated at $506,578, approximately $567 per square foot. 27 Florence St is a home located in Plymouth County with nearby schools including Indian Brook, Plymouth South Middle School, and Plymouth South High School.
Ownership History
Date
Name
Owned For
Owner Type
Purchase Details
Closed on
Feb 18, 2020
Sold by
Huddleston Paul E
Bought by
Paul E Huddleston Ft
Current Estimated Value
Purchase Details
Closed on
Dec 22, 1998
Sold by
Obrien George W and Obrien Lorraine
Bought by
Roach Henry G
Create a Home Valuation Report for This Property
The Home Valuation Report is an in-depth analysis detailing your home's value as well as a comparison with similar homes in the area
Home Values in the Area
Average Home Value in this Area
Purchase History
| Date | Buyer | Sale Price | Title Company |
|---|---|---|---|
| Paul E Huddleston Ft | -- | None Available | |
| Roach Henry G | $62,000 | -- |
Source: Public Records
Mortgage History
| Date | Status | Borrower | Loan Amount |
|---|---|---|---|
| Previous Owner | Roach Henry G | $45,325 | |
| Previous Owner | Roach Henry G | $178,000 | |
| Previous Owner | Roach Henry G | $150,000 | |
| Previous Owner | Roach Henry G | $92,400 |
Source: Public Records
Tax History Compared to Growth
Tax History
| Year | Tax Paid | Tax Assessment Tax Assessment Total Assessment is a certain percentage of the fair market value that is determined by local assessors to be the total taxable value of land and additions on the property. | Land | Improvement |
|---|---|---|---|---|
| 2025 | $4,200 | $331,000 | $176,600 | $154,400 |
| 2024 | $3,958 | $307,500 | $158,900 | $148,600 |
| 2023 | $3,896 | $284,200 | $145,700 | $138,500 |
| 2022 | $3,711 | $240,500 | $136,800 | $103,700 |
| 2021 | $3,579 | $221,500 | $136,800 | $84,700 |
| 2020 | $3,595 | $219,900 | $136,800 | $83,100 |
| 2019 | $3,492 | $211,100 | $128,000 | $83,100 |
| 2018 | $3,244 | $197,100 | $114,800 | $82,300 |
| 2017 | $3,092 | $186,500 | $114,800 | $71,700 |
| 2016 | $2,890 | $177,600 | $105,900 | $71,700 |
| 2015 | $2,692 | $173,200 | $101,500 | $71,700 |
| 2014 | $2,648 | $175,000 | $105,900 | $69,100 |
Source: Public Records
Map
Nearby Homes
- 31 Monisa Kay Dr
- 6 Seacliff Dr Unit 6
- 6 Sea Cliff Dr Unit 6
- 42 Fairway Dr Unit Golfview
- 4 Westcliff Dr Unit Golfview
- 20 Westcliff Dr Unit 20
- 18 Westcliff Dr
- 53 White Cliff Dr
- 92 Cliffside Dr
- 92 Cliffside Dr Unit White Cliff
- 15 Nonantum Rd
- 48 Menotomy Rd
- 1150 Long Pond Rd
- 1096 Long Pond Rd
- 44 Pisces Ln
- 37 Spencer Dr
- 26 Spencer Dr
- 65 Lakewood Dr
- 12 Kara's Way
- 128 Pine Mountain Dr