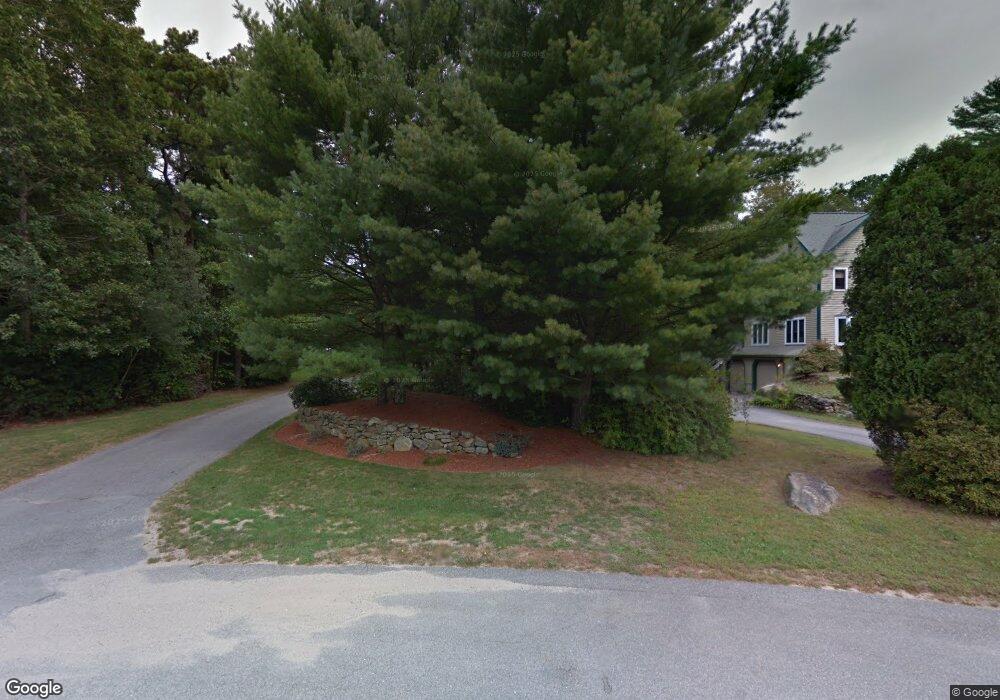
27 Forsythia Ln Westport, MA 02790
North Westport NeighborhoodEstimated Value: $799,172 - $878,000
3
Beds
--
Bath
2,618
Sq Ft
$316/Sq Ft
Est. Value
About This Home
This home is located at 27 Forsythia Ln, Westport, MA 02790 and is currently estimated at $828,543, approximately $316 per square foot. 27 Forsythia Ln is a home located in Bristol County with nearby schools including Alice A. Macomber Primary School, Westport Elementary School, and Westport Middle-High School.
Ownership History
Date
Name
Owned For
Owner Type
Purchase Details
Closed on
Apr 5, 2024
Sold by
Mingola Kenneth J and Mingola Tammy A
Bought by
Mingola
Current Estimated Value
Purchase Details
Closed on
Dec 19, 1991
Sold by
Equitable North Rt
Bought by
Mingola Kenneth J and Mingola Tammy
Create a Home Valuation Report for This Property
The Home Valuation Report is an in-depth analysis detailing your home's value as well as a comparison with similar homes in the area
Home Values in the Area
Average Home Value in this Area
Purchase History
| Date | Buyer | Sale Price | Title Company |
|---|---|---|---|
| Mingola | -- | None Available | |
| Mingola | -- | None Available | |
| Mingola Kenneth J | $65,000 | -- | |
| Mingola Kenneth J | $65,000 | -- |
Source: Public Records
Mortgage History
| Date | Status | Borrower | Loan Amount |
|---|---|---|---|
| Previous Owner | Mingola Kenneth J | $176,500 | |
| Previous Owner | Mingola Kenneth J | $190,000 |
Source: Public Records
Tax History Compared to Growth
Tax History
| Year | Tax Paid | Tax Assessment Tax Assessment Total Assessment is a certain percentage of the fair market value that is determined by local assessors to be the total taxable value of land and additions on the property. | Land | Improvement |
|---|---|---|---|---|
| 2025 | $4,947 | $664,000 | $212,300 | $451,700 |
| 2024 | $4,941 | $639,200 | $196,900 | $442,300 |
| 2023 | $5,001 | $612,900 | $187,600 | $425,300 |
| 2022 | $4,784 | $564,100 | $187,600 | $376,500 |
| 2021 | $11,896 | $517,900 | $170,700 | $347,200 |
| 2020 | $11,680 | $511,200 | $164,000 | $347,200 |
| 2019 | $759 | $504,700 | $164,000 | $340,700 |
| 2018 | $3,253 | $469,800 | $180,300 | $289,500 |
| 2017 | $1,260 | $472,000 | $180,300 | $291,700 |
| 2016 | $3,486 | $440,700 | $180,300 | $260,400 |
| 2015 | $3,400 | $428,800 | $180,300 | $248,500 |
Source: Public Records
Map
Nearby Homes