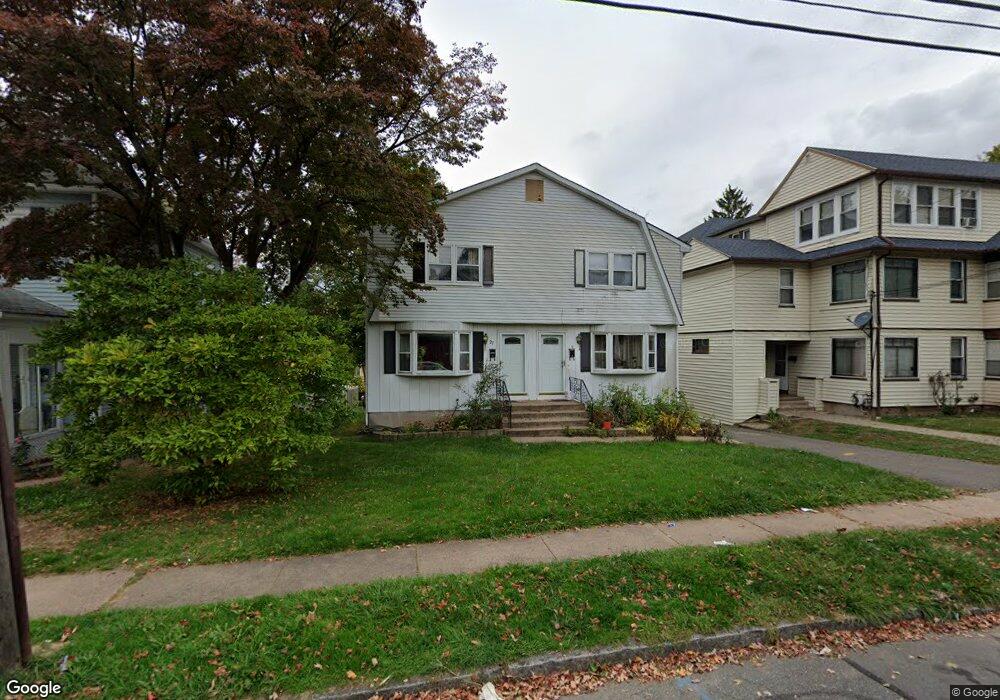
27 Francis St Unit 29 East Hartford, CT 06108
Estimated Value: $294,000 - $341,000
4
Beds
4
Baths
1,886
Sq Ft
$171/Sq Ft
Est. Value
About This Home
This home is located at 27 Francis St Unit 29, East Hartford, CT 06108 and is currently estimated at $322,987, approximately $171 per square foot. 27 Francis St Unit 29 is a home located in Hartford County with nearby schools including Dr. John A. Langford School, East Hartford Middle School, and East Hartford High School.
Ownership History
Date
Name
Owned For
Owner Type
Purchase Details
Closed on
Nov 8, 2012
Sold by
Jimenez Mays
Bought by
Powell-Dyer Lorna and Blake Schalee
Current Estimated Value
Home Financials for this Owner
Home Financials are based on the most recent Mortgage that was taken out on this home.
Original Mortgage
$152,302
Outstanding Balance
$105,393
Interest Rate
3.42%
Estimated Equity
$217,594
Purchase Details
Closed on
Sep 16, 2005
Sold by
Otero Victor A
Bought by
Jimenez Mays
Home Financials for this Owner
Home Financials are based on the most recent Mortgage that was taken out on this home.
Original Mortgage
$158,000
Interest Rate
8.2%
Purchase Details
Closed on
Feb 16, 2001
Sold by
Department Of Housing & Urban Dev
Bought by
Oteco Victor A
Purchase Details
Closed on
Oct 26, 1992
Sold by
Dinardo Ronald F and Dinardo Leslie G
Bought by
Marie Crumb N and Crumbie Paul
Create a Home Valuation Report for This Property
The Home Valuation Report is an in-depth analysis detailing your home's value as well as a comparison with similar homes in the area
Home Values in the Area
Average Home Value in this Area
Purchase History
| Date | Buyer | Sale Price | Title Company |
|---|---|---|---|
| Powell-Dyer Lorna | $145,000 | -- | |
| Jimenez Mays | $197,500 | -- | |
| Oteco Victor A | $115,000 | -- | |
| Marie Crumb N | $118,000 | -- |
Source: Public Records
Mortgage History
| Date | Status | Borrower | Loan Amount |
|---|---|---|---|
| Open | Marie Crumb N | $152,302 | |
| Previous Owner | Marie Crumb N | $158,000 |
Source: Public Records
Tax History Compared to Growth
Tax History
| Year | Tax Paid | Tax Assessment Tax Assessment Total Assessment is a certain percentage of the fair market value that is determined by local assessors to be the total taxable value of land and additions on the property. | Land | Improvement |
|---|---|---|---|---|
| 2025 | $7,051 | $153,610 | $27,080 | $126,530 |
| 2024 | $6,759 | $153,610 | $27,080 | $126,530 |
| 2023 | $6,535 | $153,610 | $27,080 | $126,530 |
| 2022 | $6,298 | $153,610 | $27,080 | $126,530 |
| 2021 | $5,386 | $109,130 | $20,520 | $88,610 |
| 2020 | $5,448 | $109,130 | $20,520 | $88,610 |
| 2019 | $5,359 | $109,130 | $20,520 | $88,610 |
| 2018 | $5,201 | $109,130 | $20,520 | $88,610 |
| 2017 | $5,135 | $109,130 | $20,520 | $88,610 |
| 2016 | $5,126 | $111,780 | $20,520 | $91,260 |
| 2015 | $5,126 | $111,780 | $20,520 | $91,260 |
| 2014 | $5,075 | $111,780 | $20,520 | $91,260 |
Source: Public Records
Map
Nearby Homes
- 59 Laraia Ave
- 40 Larrabee St
- 73 Bliss St
- 3 Price Ct
- 8 Howard Ct Unit 10
- 421 Tolland St Unit 209
- 15 Michael Ave
- 509 Burnside Ave Unit A18
- 22 Matthew Rd
- 89 Henderson Dr
- 506 Burnside Ave
- 51 Daniel St
- 0 Hillside Ave
- 71 Higbie Dr Unit 73
- 453 Burnside Ave
- 577 Goodwin St
- 32 Columbus St
- 345 Goodwin St
- 29 Joanne Dr Unit 29
- 61 Leverich Dr