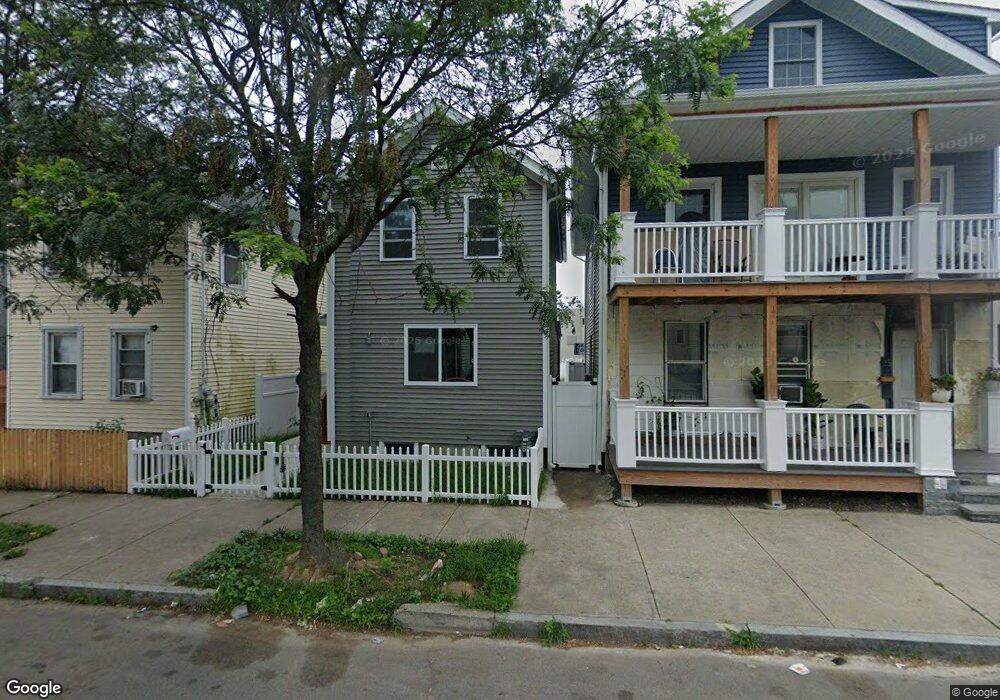
27 Frank St New Haven, CT 06519
The Hill NeighborhoodEstimated Value: $175,000 - $216,000
2
Beds
2
Baths
1,248
Sq Ft
$158/Sq Ft
Est. Value
About This Home
This home is located at 27 Frank St, New Haven, CT 06519 and is currently estimated at $197,310, approximately $158 per square foot. 27 Frank St is a home located in New Haven County with nearby schools including St Martin De Porres Academy.
Ownership History
Date
Name
Owned For
Owner Type
Purchase Details
Closed on
Jul 14, 2025
Sold by
Neighborhood Hsng Svcs Nh
Bought by
Mcgruder Larie J
Current Estimated Value
Home Financials for this Owner
Home Financials are based on the most recent Mortgage that was taken out on this home.
Original Mortgage
$47,393
Outstanding Balance
$47,149
Interest Rate
6.85%
Mortgage Type
Purchase Money Mortgage
Estimated Equity
$150,161
Purchase Details
Closed on
Mar 20, 2023
Sold by
New Haven City Of
Bought by
Neighborhood Housing Serv
Purchase Details
Closed on
Nov 20, 2017
Sold by
Braudy Nephtali and New Haven City Of
Bought by
New Haven City Of
Create a Home Valuation Report for This Property
The Home Valuation Report is an in-depth analysis detailing your home's value as well as a comparison with similar homes in the area
Home Values in the Area
Average Home Value in this Area
Purchase History
We collect this data history from publicly available records. To have your information removed, we recommend requesting removal directly through your county’s website.
| Date | Buyer | Sale Price | Title Company |
|---|---|---|---|
| Mcgruder Larie J | $195,000 | -- | |
| Mcgruder Larie J | $195,000 | -- | |
| Neighborhood Housing Serv | $1,000 | None Available | |
| Neighborhood Housing Serv | $1,000 | None Available | |
| Neighborhood Housing Serv | $1,000 | None Available | |
| New Haven City Of | $28,000 | -- | |
| New Haven City Of | $28,000 | -- |
Source: Public Records
Mortgage History
We collect this data history from publicly available records. To have your information removed, we recommend requesting removal directly through your county’s website.
| Date | Status | Borrower | Loan Amount |
|---|---|---|---|
| Open | Mcgruder Larie J | $47,393 | |
| Closed | Mcgruder Larie J | $47,393 |
Source: Public Records
Tax History
| Year | Tax Paid | Tax Assessment Tax Assessment Total Assessment is a certain percentage of the fair market value that is determined by local assessors to be the total taxable value of land and additions on the property. | Land | Improvement |
|---|---|---|---|---|
| 2025 | $827 | $21,000 | $20,510 | $490 |
| 2024 | $809 | $21,000 | $20,510 | $490 |
| 2023 | $0 | $92,540 | $20,510 | $72,030 |
| 2022 | $2,323 | $92,540 | $20,510 | $72,030 |
| 2021 | $2,323 | $60,060 | $17,640 | $42,420 |
| 2020 | $0 | $60,060 | $17,640 | $42,420 |
| 2019 | $0 | $60,060 | $17,640 | $42,420 |
| 2018 | $2,323 | $60,060 | $17,640 | $42,420 |
| 2017 | $2,323 | $60,060 | $17,640 | $42,420 |
| 2016 | $2,167 | $52,150 | $10,710 | $41,440 |
| 2015 | $2,167 | $52,150 | $10,710 | $41,440 |
| 2014 | $2,167 | $52,150 | $10,710 | $41,440 |
Source: Public Records
Map
Nearby Homes
Your Personal Tour Guide
Ask me questions while you tour the home.