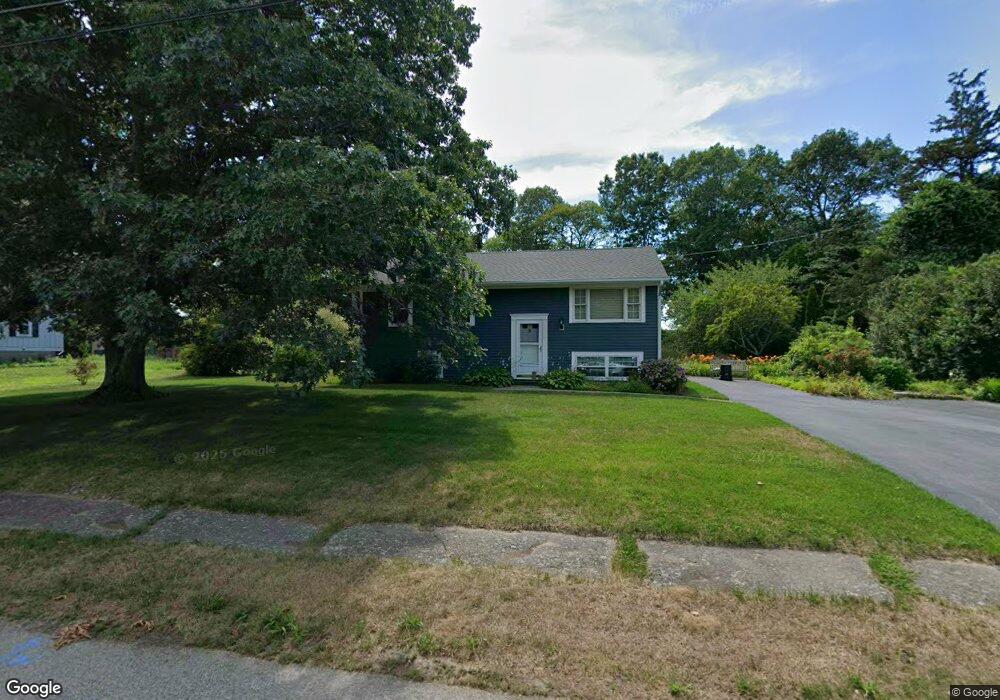
27 Frisbie Rd Marshfield, MA 02050
Estimated Value: $672,000 - $776,000
3
Beds
2
Baths
999
Sq Ft
$703/Sq Ft
Est. Value
About This Home
This home is located at 27 Frisbie Rd, Marshfield, MA 02050 and is currently estimated at $701,810, approximately $702 per square foot. 27 Frisbie Rd is a home located in Plymouth County with nearby schools including Daniel Webster, Furnace Brook Middle School, and Marshfield High School.
Ownership History
Date
Name
Owned For
Owner Type
Purchase Details
Closed on
Aug 24, 2001
Sold by
Holland Francis and Holland Christine M
Bought by
Sullivan Wayne F
Current Estimated Value
Purchase Details
Closed on
Mar 19, 1987
Sold by
Norwood David E
Bought by
Holland Francis L
Create a Home Valuation Report for This Property
The Home Valuation Report is an in-depth analysis detailing your home's value as well as a comparison with similar homes in the area
Home Values in the Area
Average Home Value in this Area
Purchase History
| Date | Buyer | Sale Price | Title Company |
|---|---|---|---|
| Sullivan Wayne F | $239,900 | -- | |
| Sullivan Wayne F | $239,900 | -- | |
| Holland Francis L | $126,500 | -- |
Source: Public Records
Mortgage History
| Date | Status | Borrower | Loan Amount |
|---|---|---|---|
| Open | Holland Francis L | $216,000 | |
| Closed | Holland Francis L | $60,000 | |
| Closed | Holland Francis L | $25,000 |
Source: Public Records
Tax History
| Year | Tax Paid | Tax Assessment Tax Assessment Total Assessment is a certain percentage of the fair market value that is determined by local assessors to be the total taxable value of land and additions on the property. | Land | Improvement |
|---|---|---|---|---|
| 2025 | $5,471 | $552,600 | $302,800 | $249,800 |
| 2024 | $5,340 | $514,000 | $288,400 | $225,600 |
| 2023 | $4,814 | $451,100 | $257,500 | $193,600 |
| 2022 | $4,814 | $371,700 | $216,300 | $155,400 |
| 2021 | $4,754 | $360,400 | $216,300 | $144,100 |
| 2020 | $4,492 | $337,000 | $195,700 | $141,300 |
| 2019 | $4,414 | $329,900 | $195,700 | $134,200 |
| 2018 | $4,294 | $321,200 | $195,700 | $125,500 |
| 2017 | $4,148 | $302,300 | $195,700 | $106,600 |
| 2016 | $4,117 | $296,600 | $195,700 | $100,900 |
| 2015 | $3,942 | $296,600 | $195,700 | $100,900 |
| 2014 | $3,736 | $281,100 | $195,700 | $85,400 |
Source: Public Records
Map
Nearby Homes
- 30 Chandler Dr
- 7 Pierce Rd
- 92 Salt Meadow Waye
- 42 Carr Rd
- 155 Quincy Ave
- 32 Gratto Rd
- 290 S River St
- 38 Winthrop Dr
- 39 High Beacon Way
- 6 Maple Ln
- 85 Constitution Rd
- 16 Schooner Way
- 86 Barouche Dr
- 14 Ferry St
- 86 Telegraph Hill Rd
- 235 Main St
- 29 Spyglass Landing Dr
- 152 Acorn St
- 1192 S River St
- 431 Moraine St
Your Personal Tour Guide
Ask me questions while you tour the home.