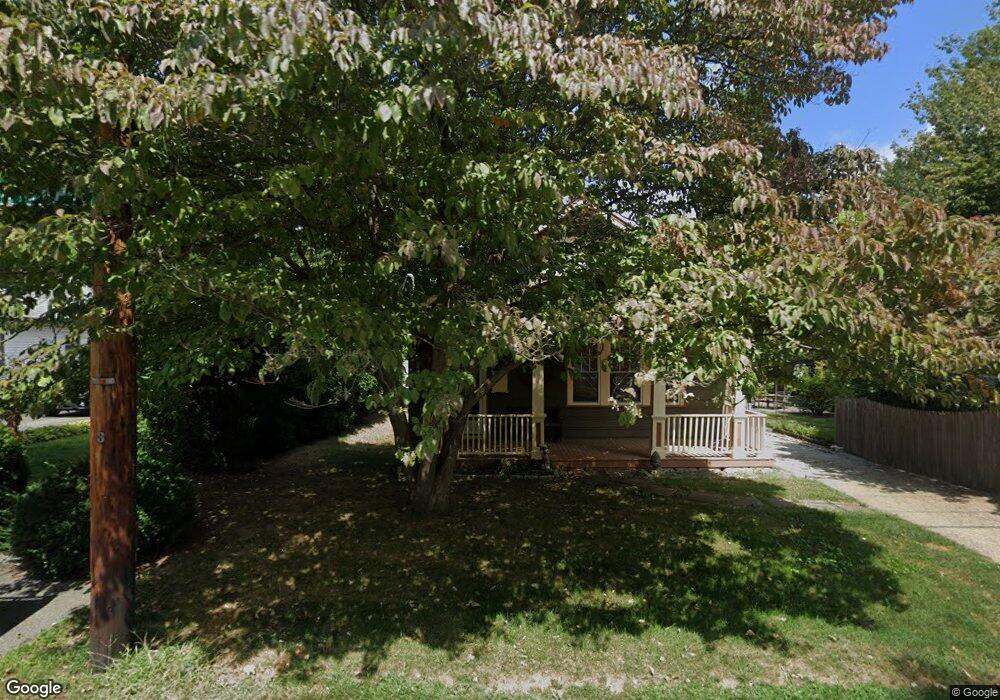
27 General St Providence, RI 02904
Wanskuck NeighborhoodEstimated Value: $375,000 - $423,000
2
Beds
1
Bath
1,560
Sq Ft
$260/Sq Ft
Est. Value
About This Home
This home is located at 27 General St, Providence, RI 02904 and is currently estimated at $404,902, approximately $259 per square foot. 27 General St is a home located in Providence County with nearby schools including St. Augustine School, St. Pius V Catholic School, and La Salle Academy.
Ownership History
Date
Name
Owned For
Owner Type
Purchase Details
Closed on
Oct 24, 2017
Sold by
Bertrand Thomas E
Bought by
Thomas E Bertrand Lt
Current Estimated Value
Purchase Details
Closed on
Aug 16, 1994
Sold by
Hagglund Carol
Bought by
Bertram Thomas E
Home Financials for this Owner
Home Financials are based on the most recent Mortgage that was taken out on this home.
Original Mortgage
$60,000
Interest Rate
8.52%
Create a Home Valuation Report for This Property
The Home Valuation Report is an in-depth analysis detailing your home's value as well as a comparison with similar homes in the area
Home Values in the Area
Average Home Value in this Area
Purchase History
| Date | Buyer | Sale Price | Title Company |
|---|---|---|---|
| Thomas E Bertrand Lt | -- | -- | |
| Bertram Thomas E | $77,000 | -- |
Source: Public Records
Mortgage History
| Date | Status | Borrower | Loan Amount |
|---|---|---|---|
| Previous Owner | Bertram Thomas E | $60,000 |
Source: Public Records
Tax History
| Year | Tax Paid | Tax Assessment Tax Assessment Total Assessment is a certain percentage of the fair market value that is determined by local assessors to be the total taxable value of land and additions on the property. | Land | Improvement |
|---|---|---|---|---|
| 2025 | $3,174 | $377,900 | $172,300 | $205,600 |
| 2024 | $5,002 | $272,600 | $94,500 | $178,100 |
| 2023 | $5,002 | $272,600 | $94,500 | $178,100 |
| 2022 | $4,852 | $272,600 | $94,500 | $178,100 |
| 2021 | $4,296 | $174,900 | $52,000 | $122,900 |
| 2020 | $4,296 | $174,900 | $52,000 | $122,900 |
| 2019 | $4,296 | $174,900 | $52,000 | $122,900 |
| 2018 | $4,407 | $137,900 | $44,100 | $93,800 |
| 2017 | $4,407 | $137,900 | $44,100 | $93,800 |
| 2016 | $4,407 | $137,900 | $44,100 | $93,800 |
| 2015 | $3,995 | $120,700 | $44,100 | $76,600 |
| 2014 | $4,074 | $120,700 | $44,100 | $76,600 |
| 2013 | $4,074 | $120,700 | $44,100 | $76,600 |
Source: Public Records
Map
Nearby Homes
- 115 Hazael St
- 1039 Douglas Ave
- 31 Joseph St
- 25 Hymer St
- 835 River Ave
- 30 Oneil St
- 23 Concannon St
- 873 Douglas Ave
- 876 Douglas Ave
- 871 Douglas Ave
- 1166 Douglas Ave
- 860 Douglas Ave
- 73 Wainwright St
- 272 Veazie St
- 0 Wainwright St
- 252 Gentian Ave
- 160 Cumberland St
- 825 Douglas Ave
- 82 Lucille St
- 36 Hereford St