Estimated Value: $176,052 - $230,000
--
Bed
1
Bath
1,136
Sq Ft
$179/Sq Ft
Est. Value
About This Home
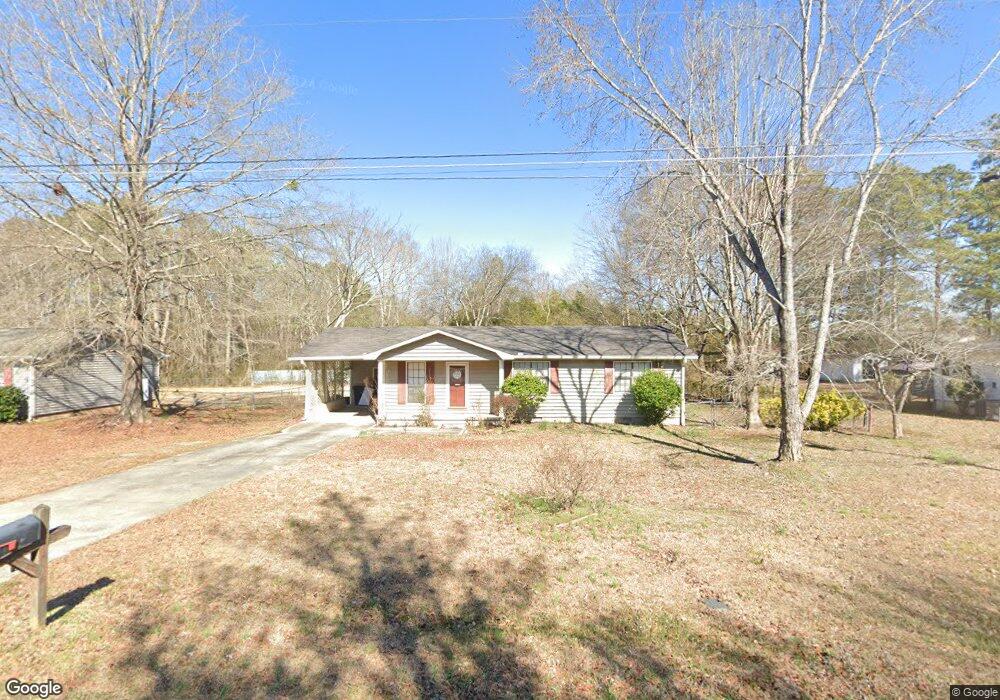
This home is located at 27 Glen View Dr NE, Rome, GA 30165 and is currently estimated at $203,013, approximately $178 per square foot. 27 Glen View Dr NE is a home located in Floyd County with nearby schools including Armuchee Middle School, Armuchee High School, and Unity Christian School.
Ownership History
Date
Name
Owned For
Owner Type
Purchase Details
Closed on
May 9, 2019
Sold by
Lovell Vicky Lynn
Bought by
Henderson Susan W
Current Estimated Value
Purchase Details
Closed on
Oct 15, 2018
Sold by
Westmoreland Shirley Jo Estate
Bought by
Lovell Vicky Lynn
Purchase Details
Closed on
Nov 27, 1996
Sold by
Stepp Rodney E and Stepp Valerie B
Bought by
Westmoreland Shirley
Purchase Details
Closed on
Nov 1, 1993
Sold by
Sutler Patricia A
Bought by
Stepp Rodney E and Stepp Valerie B
Purchase Details
Closed on
May 13, 1981
Sold by
Trotter Eugene
Bought by
Sutler Patricia A
Purchase Details
Closed on
May 12, 1981
Sold by
Dempsey Grace
Bought by
Trotter Eugene
Purchase Details
Closed on
May 10, 1975
Sold by
Miller Harry R
Bought by
Dempsey Grace
Purchase Details
Closed on
Apr 18, 1972
Sold by
Garner Lawrence A
Bought by
Miller Harry R
Purchase Details
Closed on
Jan 26, 1967
Sold by
Rome Realty & Loan Co
Bought by
Garner Lawrence A
Purchase Details
Closed on
Jan 1, 1953
Bought by
Rome Realty & Loan Co
Create a Home Valuation Report for This Property
The Home Valuation Report is an in-depth analysis detailing your home's value as well as a comparison with similar homes in the area
Home Values in the Area
Average Home Value in this Area
Purchase History
| Date | Buyer | Sale Price | Title Company |
|---|---|---|---|
| Henderson Susan W | $103,000 | -- | |
| Lovell Vicky Lynn | -- | -- | |
| Westmoreland Shirley | $73,500 | -- | |
| Stepp Rodney E | $48,000 | -- | |
| Sutler Patricia A | $38,000 | -- | |
| Trotter Eugene | $4,000 | -- | |
| Dempsey Grace | $3,500 | -- | |
| Miller Harry R | $4,000 | -- | |
| Garner Lawrence A | $600 | -- | |
| Rome Realty & Loan Co | -- | -- |
Source: Public Records
Tax History Compared to Growth
Tax History
| Year | Tax Paid | Tax Assessment Tax Assessment Total Assessment is a certain percentage of the fair market value that is determined by local assessors to be the total taxable value of land and additions on the property. | Land | Improvement |
|---|---|---|---|---|
| 2024 | $1,951 | $65,603 | $7,208 | $58,395 |
| 2023 | $1,877 | $63,214 | $6,360 | $56,854 |
| 2022 | $1,483 | $49,974 | $5,088 | $44,886 |
| 2021 | $1,261 | $41,779 | $5,088 | $36,691 |
| 2020 | $1,143 | $37,542 | $3,816 | $33,726 |
| 2019 | $960 | $31,948 | $3,816 | $28,132 |
| 2018 | $202 | $25,086 | $3,816 | $21,270 |
| 2017 | $202 | $24,446 | $3,816 | $20,630 |
| 2016 | $204 | $24,008 | $3,800 | $20,208 |
| 2015 | $190 | $24,008 | $3,800 | $20,208 |
| 2014 | $190 | $24,008 | $3,800 | $20,208 |
Source: Public Records
Map
Nearby Homes
- The Pearson Plan at Southbend
- The Harrington Plan at Southbend
- The Landen Plan at Southbend
- The Benson II Plan at Southbend
- The Caldwell Plan at Southbend
- The Bradley Plan at Southbend
- The McGinnis Plan at Southbend
- The Crawford Plan at Southbend
- 4 Sleepy Oaks Trail NE
- 109 Royal Oak Dr NE
- 100 Royal Oak Dr NE
- 10 Oak View Dr NE
- 107 Selman Rd NW
- 24 Sleepy Oaks Trail NE
- 17 Royal Oak Dr NE
- 15 Oakcrest Trail NE
- 665 Old Summerville Rd NW
- 637 Old Summerville Rd NW
- 631 Old Summerville Rd NW
- 3158 Martha Berry Hwy
- 29 Glen View Dr NE
- 25 Glen View Dr NE
- 31 Glen View Dr NE
- 116 Beard Dr NE
- 116 Beard Dr NE
- 28 Glen View Dr NE
- 23 Glen View Dr NE
- 26 Glen View Dr NE
- 30 Glen View Dr NE
- 24 Glen View Dr NE
- 32 Glen View Dr NE
- 33 Glen View Dr NE
- 190 Beard Dr NE
- 190 Beard Dr NE
- 190 Beard Dr NE
- 21 Glen View Dr NE
- 34 Glen View Dr NE
- 35 Glen View Dr NE
- 20 Glen View Dr NE
- 36 Glen View Dr NE