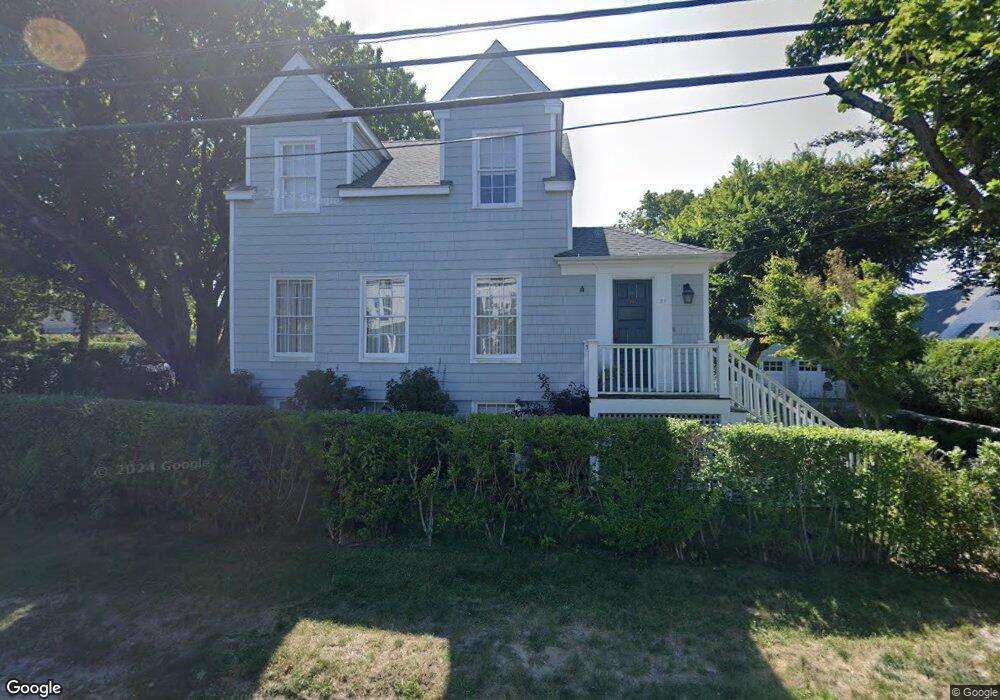
27 Glover St Sag Harbor, NY 11963
Estimated Value: $3,459,000 - $4,313,267
5
Beds
4
Baths
1,215
Sq Ft
$3,287/Sq Ft
Est. Value
About This Home
This home is located at 27 Glover St, Sag Harbor, NY 11963 and is currently estimated at $3,994,067, approximately $3,287 per square foot. 27 Glover St is a home located in Suffolk County with nearby schools including Sag Harbor Elementary School, Pierson Middle/High School, and Ross Lower School.
Ownership History
Date
Name
Owned For
Owner Type
Purchase Details
Closed on
May 17, 2016
Sold by
Newberg Esther R
Bought by
Newberg Esther R
Current Estimated Value
Purchase Details
Closed on
Oct 23, 1998
Sold by
Barnett Robert
Bought by
Newberg Esther R
Home Financials for this Owner
Home Financials are based on the most recent Mortgage that was taken out on this home.
Original Mortgage
$572,000
Outstanding Balance
$123,506
Interest Rate
6.74%
Estimated Equity
$3,870,561
Purchase Details
Closed on
Dec 18, 1997
Sold by
Thommen Arthur C and Thommen Eugene H
Bought by
Barnett Robert
Home Financials for this Owner
Home Financials are based on the most recent Mortgage that was taken out on this home.
Original Mortgage
$253,800
Interest Rate
7.25%
Create a Home Valuation Report for This Property
The Home Valuation Report is an in-depth analysis detailing your home's value as well as a comparison with similar homes in the area
Home Values in the Area
Average Home Value in this Area
Purchase History
| Date | Buyer | Sale Price | Title Company |
|---|---|---|---|
| Newberg Esther R | -- | None Available | |
| Newberg Esther R | $715,000 | Ticor Title Guarantee Compan | |
| Barnett Robert | $282,000 | -- |
Source: Public Records
Mortgage History
| Date | Status | Borrower | Loan Amount |
|---|---|---|---|
| Open | Newberg Esther R | $572,000 | |
| Previous Owner | Barnett Robert | $253,800 |
Source: Public Records
Tax History Compared to Growth
Tax History
| Year | Tax Paid | Tax Assessment Tax Assessment Total Assessment is a certain percentage of the fair market value that is determined by local assessors to be the total taxable value of land and additions on the property. | Land | Improvement |
|---|---|---|---|---|
| 2024 | $6,433 | $2,316,000 | $1,592,400 | $723,600 |
| 2023 | $6,369 | $2,316,000 | $1,592,400 | $723,600 |
| 2022 | $5,572 | $2,052,200 | $1,592,400 | $459,800 |
| 2021 | $5,607 | $2,052,200 | $1,592,400 | $459,800 |
| 2020 | $10,998 | $2,052,200 | $1,592,400 | $459,800 |
| 2019 | $16,351 | $0 | $0 | $0 |
| 2018 | -- | $1,822,300 | $1,393,400 | $428,900 |
| 2017 | $10,470 | $1,822,300 | $1,393,400 | $428,900 |
| 2016 | $10,889 | $1,822,300 | $1,393,400 | $428,900 |
| 2015 | -- | $1,822,300 | $1,393,400 | $428,900 |
| 2014 | -- | $1,822,300 | $1,393,400 | $428,900 |
Source: Public Records
Map
Nearby Homes