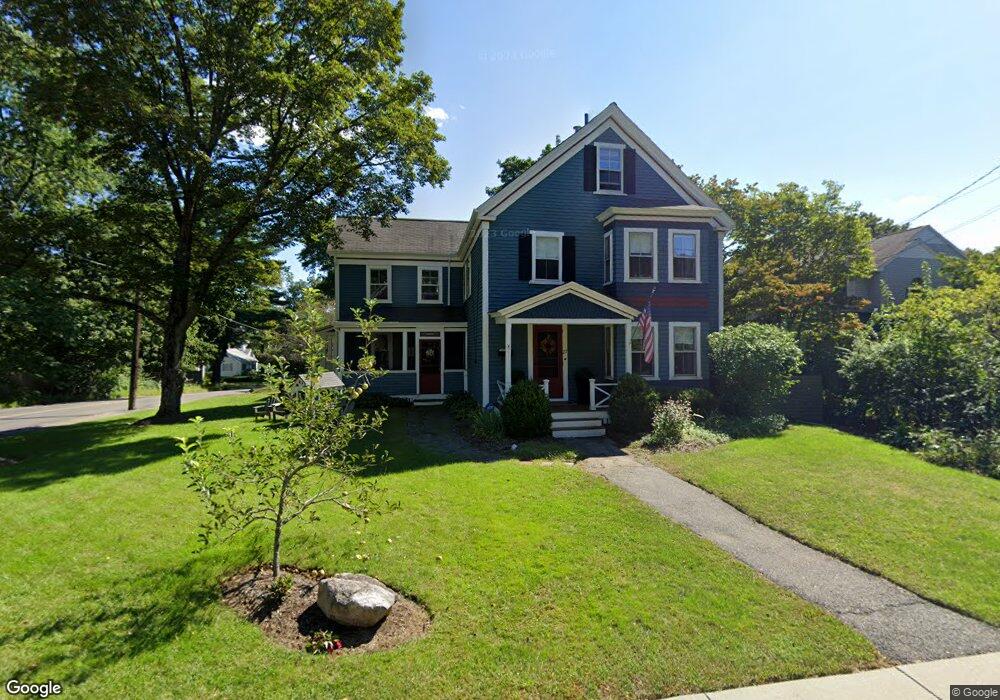
27 Green St Medfield, MA 02052
Estimated Value: $956,000 - $1,045,000
4
Beds
2
Baths
2,050
Sq Ft
$483/Sq Ft
Est. Value
About This Home
This home is located at 27 Green St, Medfield, MA 02052 and is currently estimated at $989,276, approximately $482 per square foot. 27 Green St is a home located in Norfolk County with nearby schools including Memorial School, Ralph Wheelock School, and Dale Street School.
Ownership History
Date
Name
Owned For
Owner Type
Purchase Details
Closed on
Jun 6, 2019
Sold by
Struble Thomas F and Struble Caitlin E
Bought by
Struble Ft
Current Estimated Value
Purchase Details
Closed on
Aug 25, 2011
Sold by
Rioux Ronald W and Rioux Patricia A
Bought by
Struble Thomas F and Struble Caitlin E
Home Financials for this Owner
Home Financials are based on the most recent Mortgage that was taken out on this home.
Original Mortgage
$287,920
Interest Rate
4.53%
Mortgage Type
Purchase Money Mortgage
Create a Home Valuation Report for This Property
The Home Valuation Report is an in-depth analysis detailing your home's value as well as a comparison with similar homes in the area
Home Values in the Area
Average Home Value in this Area
Purchase History
| Date | Buyer | Sale Price | Title Company |
|---|---|---|---|
| Struble Ft | -- | -- | |
| Struble Ft | -- | -- | |
| Struble Thomas F | $359,900 | -- | |
| Struble Thomas F | $359,900 | -- |
Source: Public Records
Mortgage History
| Date | Status | Borrower | Loan Amount |
|---|---|---|---|
| Previous Owner | Struble Thomas F | $287,920 |
Source: Public Records
Tax History Compared to Growth
Tax History
| Year | Tax Paid | Tax Assessment Tax Assessment Total Assessment is a certain percentage of the fair market value that is determined by local assessors to be the total taxable value of land and additions on the property. | Land | Improvement |
|---|---|---|---|---|
| 2025 | $11,161 | $808,800 | $391,300 | $417,500 |
| 2024 | $10,763 | $735,200 | $354,900 | $380,300 |
| 2023 | $10,560 | $684,400 | $338,700 | $345,700 |
| 2022 | $10,161 | $583,300 | $322,600 | $260,700 |
| 2021 | $9,853 | $554,800 | $314,500 | $240,300 |
| 2020 | $9,689 | $543,400 | $311,300 | $232,100 |
| 2019 | $9,491 | $531,100 | $306,500 | $224,600 |
| 2018 | $8,759 | $514,300 | $296,800 | $217,500 |
| 2017 | $8,371 | $495,600 | $306,500 | $189,100 |
| 2016 | $7,120 | $425,100 | $300,000 | $125,100 |
| 2015 | $6,241 | $389,100 | $266,300 | $122,800 |
| 2014 | $5,697 | $353,400 | $230,600 | $122,800 |
Source: Public Records
Map
Nearby Homes
- 431 Main St Unit 5
- 34 Frairy St
- 46 Frairy St
- 8 Turtlebrook Way
- 3 Hennery Way Bld E Unit 3
- 14 Harding St
- 94 Pleasant St
- 12 Spruce Way
- 80 West St
- 3 Shining Valley Cir
- 18 Hearthstone Dr
- 10 Hillcrest Rd
- 23 Cross St
- 6 Alcott Way
- 75 Bridge St
- 94 Elm St
- 111 Elm St
- 3 Spring Valley Rd
- 37 Crestview Dr
- 270 South St