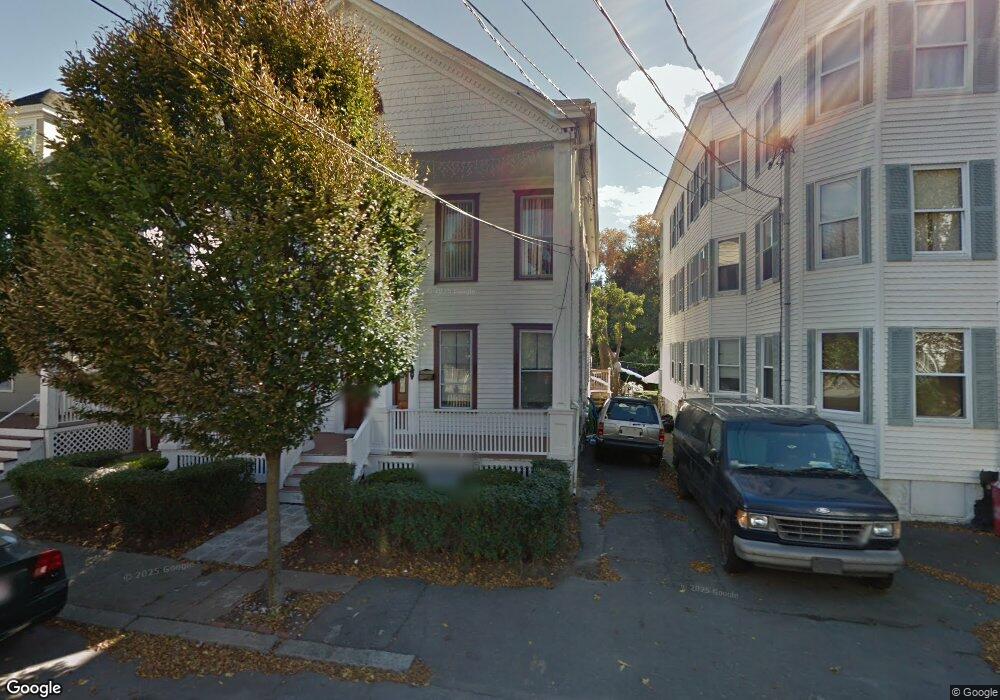
27 Hancock St Unit 2 Salem, MA 01970
South Salem NeighborhoodEstimated Value: $1,039,000 - $1,412,000
3
Beds
1
Bath
1,400
Sq Ft
$875/Sq Ft
Est. Value
About This Home
This home is located at 27 Hancock St Unit 2, Salem, MA 01970 and is currently estimated at $1,225,500, approximately $875 per square foot. 27 Hancock St Unit 2 is a home located in Essex County with nearby schools including Saltonstall School, Carlton Elementary School, and Bates Elementary School.
Ownership History
Date
Name
Owned For
Owner Type
Purchase Details
Closed on
Jun 30, 2023
Sold by
North Shore Holdings Llc
Bought by
Curran Logan and Shiller Peter
Current Estimated Value
Home Financials for this Owner
Home Financials are based on the most recent Mortgage that was taken out on this home.
Original Mortgage
$1,123,650
Outstanding Balance
$1,089,991
Interest Rate
6.39%
Mortgage Type
VA
Estimated Equity
$135,509
Purchase Details
Closed on
Mar 10, 2023
Sold by
North Shore Prop Grp Llc
Bought by
North Shore Holdings Llc
Home Financials for this Owner
Home Financials are based on the most recent Mortgage that was taken out on this home.
Original Mortgage
$765,000
Interest Rate
6.13%
Mortgage Type
Commercial
Purchase Details
Closed on
Dec 30, 2022
Sold by
North Shore Prop Grp Llc
Bought by
North Shore Prop Grp Llc and Buonfiglio
Purchase Details
Closed on
Oct 11, 2022
Sold by
Rodriguez Patricia A and Tejada Wander A
Bought by
North Shore Prop Grp Llc
Home Financials for this Owner
Home Financials are based on the most recent Mortgage that was taken out on this home.
Original Mortgage
$581,500
Interest Rate
5.55%
Mortgage Type
Purchase Money Mortgage
Purchase Details
Closed on
Aug 19, 2021
Sold by
Rodriguez Patricia A
Bought by
Rodriguez Patricia A and Tejeda Wander A
Home Financials for this Owner
Home Financials are based on the most recent Mortgage that was taken out on this home.
Original Mortgage
$457,500
Interest Rate
2.9%
Mortgage Type
Purchase Money Mortgage
Purchase Details
Closed on
Feb 3, 2006
Sold by
Mcneill Irene and Wensley Janet
Bought by
Espinal Yolanda
Home Financials for this Owner
Home Financials are based on the most recent Mortgage that was taken out on this home.
Original Mortgage
$319,200
Interest Rate
6.31%
Mortgage Type
Purchase Money Mortgage
Create a Home Valuation Report for This Property
The Home Valuation Report is an in-depth analysis detailing your home's value as well as a comparison with similar homes in the area
Home Values in the Area
Average Home Value in this Area
Purchase History
| Date | Buyer | Sale Price | Title Company |
|---|---|---|---|
| Curran Logan | $1,100,000 | None Available | |
| North Shore Holdings Llc | -- | None Available | |
| North Shore Holdings Llc | -- | None Available | |
| North Shore Prop Grp Llc | -- | None Available | |
| North Shore Prop Grp Llc | -- | None Available | |
| North Shore Prop Grp Llc | $470,000 | None Available | |
| Rodriguez Patricia A | -- | None Available | |
| Rodriguez Patricia A | $610,000 | None Available | |
| Rodriguez Patricia A | -- | None Available | |
| Rodriguez Patricia A | $610,000 | None Available | |
| Espinal Yolanda | $399,000 | -- | |
| Espinal Yolanda | $399,000 | -- |
Source: Public Records
Mortgage History
| Date | Status | Borrower | Loan Amount |
|---|---|---|---|
| Open | Curran Logan | $1,123,650 | |
| Previous Owner | North Shore Holdings Llc | $765,000 | |
| Previous Owner | North Shore Prop Grp Llc | $581,500 | |
| Previous Owner | Rodriguez Patricia A | $457,500 | |
| Previous Owner | Espinal Yolanda | $319,200 | |
| Previous Owner | Espinal Yolanda | $79,800 |
Source: Public Records
Tax History
| Year | Tax Paid | Tax Assessment Tax Assessment Total Assessment is a certain percentage of the fair market value that is determined by local assessors to be the total taxable value of land and additions on the property. | Land | Improvement |
|---|---|---|---|---|
| 2025 | $12,643 | $1,114,900 | $162,500 | $952,400 |
| 2024 | $12,069 | $1,038,600 | $153,900 | $884,700 |
| 2023 | $2,964 | $236,900 | $142,500 | $94,400 |
| 2022 | $6,936 | $523,500 | $134,000 | $389,500 |
| 2021 | $6,329 | $458,600 | $134,000 | $324,600 |
| 2020 | $6,062 | $419,500 | $115,700 | $303,800 |
| 2019 | $6,114 | $404,900 | $110,000 | $294,900 |
| 2018 | $5,626 | $365,800 | $104,900 | $260,900 |
| 2017 | $5,224 | $329,400 | $85,500 | $243,900 |
| 2016 | $5,025 | $320,700 | $80,900 | $239,800 |
| 2015 | $4,854 | $295,800 | $73,000 | $222,800 |
Source: Public Records
Map
Nearby Homes
- 7 Fairfield St
- 13 Roslyn St Unit 2
- 6R Hazel Terrace Unit 1
- 10 Hazel St Unit 2
- 3 Chase St
- 185 Lafayette St Unit 3
- 59 Leach St Unit 2
- 22 Prescott St Unit 1
- 4 Willow Ave Unit 2
- 88 Congress St Unit 3
- 9 Glover St Unit 1
- 15 Phelps St Unit 1
- 29 Ocean Ave Unit 4
- 1 Shore Ave
- 24 Wisteria St Unit 2
- 326 Lafayette St Unit 2
- 259 Jefferson Ave
- 11 Summer St
- 263 Jefferson Ave
- 289 Essex St Unit 211
- 27 Hancock St
- 29 Hancock St
- 25 Hancock St
- 32 Cabot St
- 31 Hancock St
- 34 1/2-36 Cabot St
- 30 Cabot St
- 1 Geneva St
- 35 Hancock St Unit 3
- 35 Hancock St Unit 2
- 35 Hancock St Unit 1
- 37 Hancock St Unit 1
- 37 Hancock St Unit 2
- 24 Hancock St Unit 2
- 26 Hancock St Unit 3L
- 26 Hancock St Unit 3R
- 26 Hancock St Unit 2L
- 26 Hancock St Unit 2R
- 26 Hancock St Unit 1L
- 26 Hancock St Unit 1R
Your Personal Tour Guide
Ask me questions while you tour the home.