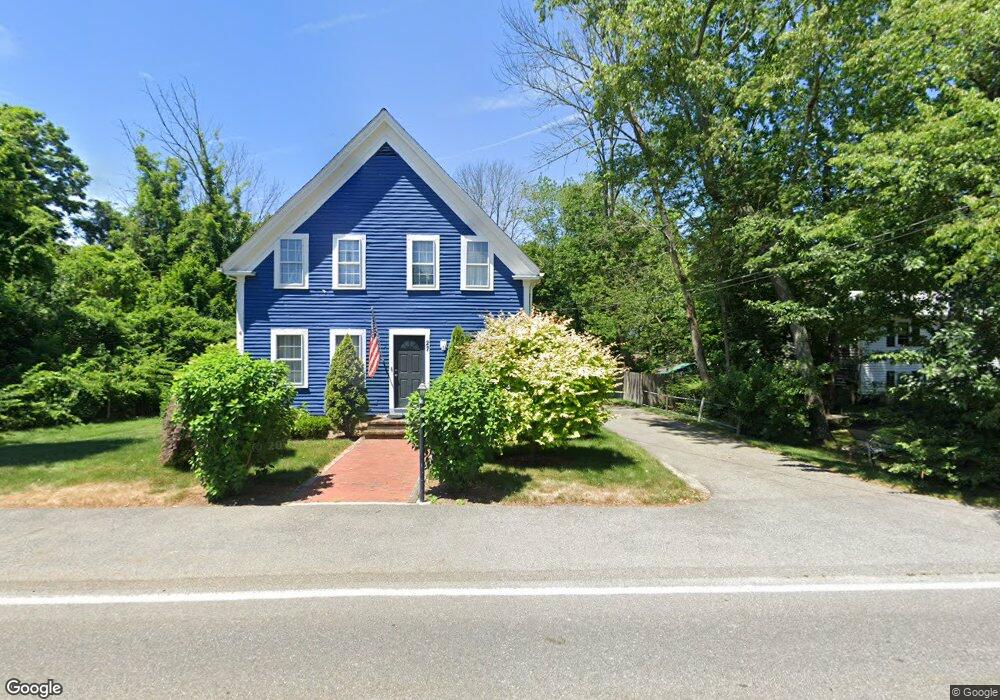
27 High St Hanson, MA 02341
Estimated Value: $470,000 - $542,000
4
Beds
1
Bath
1,183
Sq Ft
$428/Sq Ft
Est. Value
About This Home
This home is located at 27 High St, Hanson, MA 02341 and is currently estimated at $506,108, approximately $427 per square foot. 27 High St is a home located in Plymouth County.
Ownership History
Date
Name
Owned For
Owner Type
Purchase Details
Closed on
Jul 1, 2010
Sold by
Fnma
Bought by
Rothwell John F
Current Estimated Value
Home Financials for this Owner
Home Financials are based on the most recent Mortgage that was taken out on this home.
Original Mortgage
$172,495
Outstanding Balance
$115,538
Interest Rate
4.88%
Mortgage Type
Purchase Money Mortgage
Estimated Equity
$390,570
Purchase Details
Closed on
Apr 5, 2010
Sold by
Simmons Julia A and Simmons Frank E
Bought by
Federal National Mortgage Association
Purchase Details
Closed on
May 27, 1992
Sold by
Henderson Kerry D and Henderson Bonnie M
Bought by
Simmons Frank E and Simmons Patricia M
Create a Home Valuation Report for This Property
The Home Valuation Report is an in-depth analysis detailing your home's value as well as a comparison with similar homes in the area
Home Values in the Area
Average Home Value in this Area
Purchase History
| Date | Buyer | Sale Price | Title Company |
|---|---|---|---|
| Rothwell John F | $157,000 | -- | |
| Federal National Mortgage Association | $189,746 | -- | |
| Simmons Frank E | $116,900 | -- |
Source: Public Records
Mortgage History
| Date | Status | Borrower | Loan Amount |
|---|---|---|---|
| Open | Rothwell John F | $172,495 | |
| Previous Owner | Simmons Frank E | $40,000 | |
| Previous Owner | Simmons Frank E | $222,400 | |
| Previous Owner | Simmons Frank E | $205,000 |
Source: Public Records
Tax History
| Year | Tax Paid | Tax Assessment Tax Assessment Total Assessment is a certain percentage of the fair market value that is determined by local assessors to be the total taxable value of land and additions on the property. | Land | Improvement |
|---|---|---|---|---|
| 2025 | $5,685 | $424,900 | $177,700 | $247,200 |
| 2024 | $5,521 | $412,600 | $172,600 | $240,000 |
| 2023 | $5,410 | $381,500 | $172,600 | $208,900 |
| 2022 | $5,235 | $346,900 | $156,900 | $190,000 |
| 2021 | $4,596 | $304,400 | $150,900 | $153,500 |
| 2020 | $11,227 | $260,000 | $145,700 | $114,300 |
| 2019 | $3,295 | $212,200 | $142,900 | $69,300 |
| 2018 | $3,256 | $205,700 | $137,400 | $68,300 |
| 2017 | $3,154 | $197,400 | $130,900 | $66,500 |
| 2016 | $3,244 | $196,000 | $130,900 | $65,100 |
| 2015 | $3,103 | $194,900 | $130,900 | $64,000 |
Source: Public Records
Map
Nearby Homes
- 38 High St Unit 8
- 1054 Main St
- 72 Phillips St
- 170 Elm St
- Lot 6 Way
- Lot 2 Harvard Rd
- 361A County Rd
- 361 County Rd
- 61 Sawmill Ln
- 61 Sawmill Ln Unit 61
- 26 Franklin St
- 1754 Central St
- 501 W Washington St
- 126-130 Franklin St
- 161 Winter St Unit 11
- 20 Country Farm Rd
- 11 Carol Ave
- 143 Plymouth St
- 54 Leaf Ln
- 134 Crescent St
- 31 High St
- 25 Park St
- 962 Main St
- 962 Main St Unit 1
- 20 Park St
- 6 Park St
- 48 High St
- 38 High St Unit 3
- 38 High St Unit D17
- 38 High St Unit D16
- 38 High St Unit D15
- 38 High St Unit D14
- 38 High St Unit C12
- 38 High St Unit C11
- 38 High St Unit C10
- 38 High St Unit C9
- 38 High St Unit B8
- 38 High St Unit B7
- 38 High St Unit B6
- 38 High St Unit B5
Your Personal Tour Guide
Ask me questions while you tour the home.