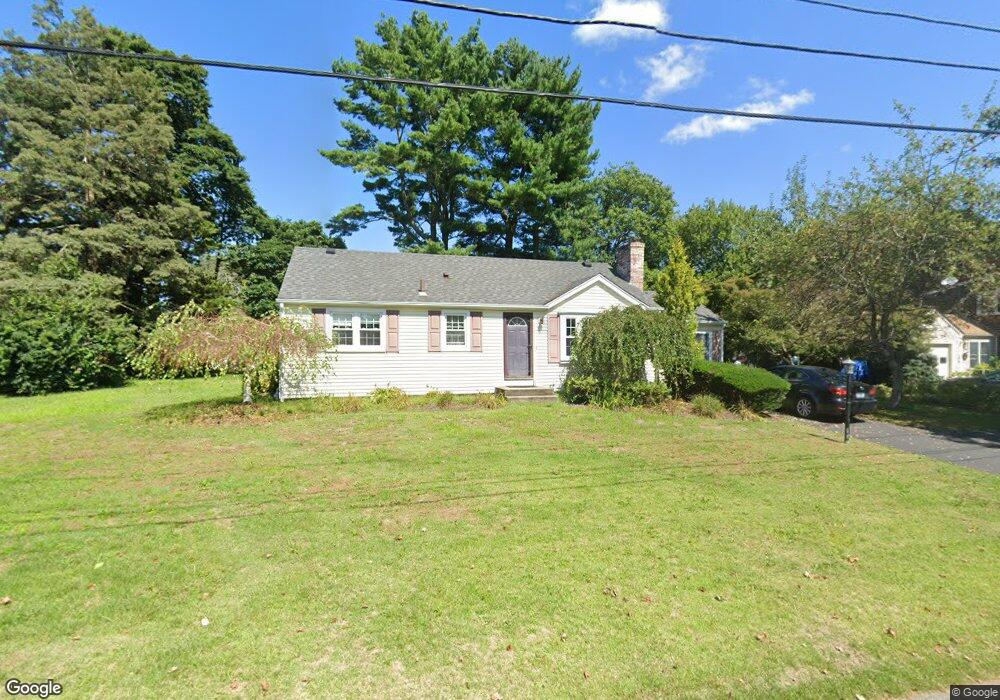
27 Highview Ave Barrington, RI 02806
North Barrington NeighborhoodEstimated Value: $538,789 - $673,000
3
Beds
2
Baths
1,500
Sq Ft
$401/Sq Ft
Est. Value
About This Home
This home is located at 27 Highview Ave, Barrington, RI 02806 and is currently estimated at $602,197, approximately $401 per square foot. 27 Highview Ave is a home located in Bristol County with nearby schools including Barrington High School, St Luke Elementary School, and Barrington Christian Academy.
Ownership History
Date
Name
Owned For
Owner Type
Purchase Details
Closed on
Oct 21, 2025
Sold by
Amato David B
Bought by
2025 David B Amato T and 2025 Amato
Current Estimated Value
Purchase Details
Closed on
Nov 28, 1989
Sold by
Totushek Kenneth
Bought by
Amato David
Create a Home Valuation Report for This Property
The Home Valuation Report is an in-depth analysis detailing your home's value as well as a comparison with similar homes in the area
Home Values in the Area
Average Home Value in this Area
Purchase History
| Date | Buyer | Sale Price | Title Company |
|---|---|---|---|
| 2025 David B Amato T | -- | -- | |
| Amato David | $140,000 | -- | |
| Amato David | $140,000 | -- |
Source: Public Records
Mortgage History
| Date | Status | Borrower | Loan Amount |
|---|---|---|---|
| Previous Owner | Amato David | $85,400 | |
| Previous Owner | Amato David | $142,000 |
Source: Public Records
Tax History
| Year | Tax Paid | Tax Assessment Tax Assessment Total Assessment is a certain percentage of the fair market value that is determined by local assessors to be the total taxable value of land and additions on the property. | Land | Improvement |
|---|---|---|---|---|
| 2025 | $6,765 | $441,000 | $264,000 | $177,000 |
| 2024 | $6,505 | $441,000 | $264,000 | $177,000 |
| 2023 | $7,207 | $355,000 | $218,000 | $137,000 |
| 2022 | $6,976 | $355,000 | $218,000 | $137,000 |
| 2021 | $6,798 | $355,000 | $218,000 | $137,000 |
| 2020 | $6,186 | $296,000 | $146,000 | $150,000 |
| 2019 | $5,950 | $296,000 | $146,000 | $150,000 |
| 2018 | $5,772 | $296,000 | $146,000 | $150,000 |
| 2017 | $5,130 | $256,500 | $129,800 | $126,700 |
| 2016 | $4,732 | $256,500 | $129,800 | $126,700 |
| 2015 | $4,681 | $256,500 | $129,800 | $126,700 |
| 2014 | $4,619 | $252,400 | $129,800 | $122,600 |
Source: Public Records
Map
Nearby Homes
Your Personal Tour Guide
Ask me questions while you tour the home.