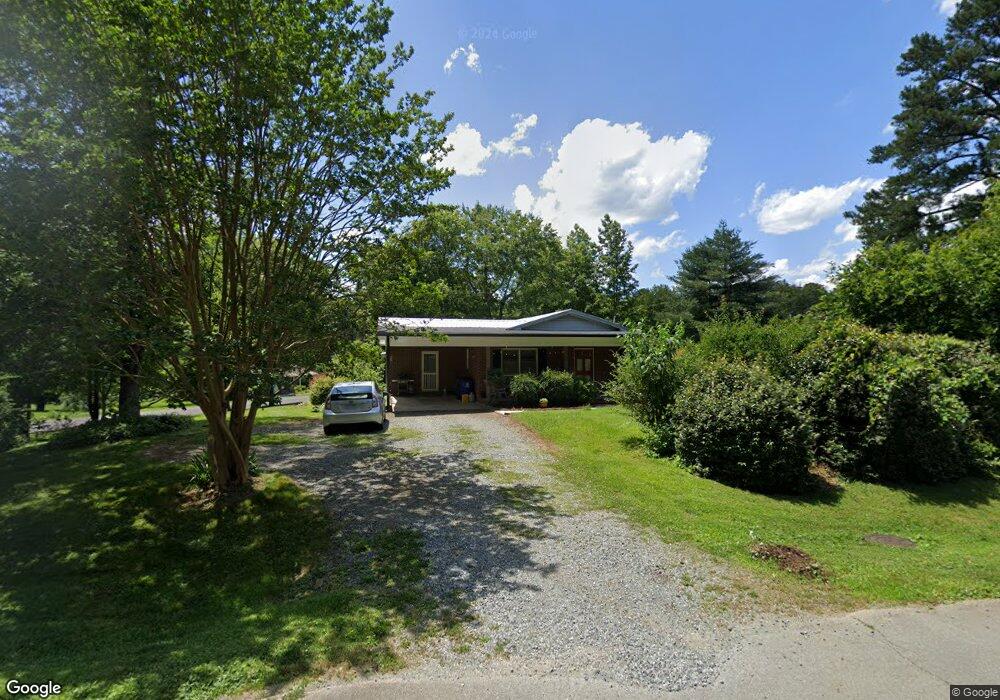
27 Hillcrest Dr Pittsboro, NC 27312
Estimated Value: $330,000 - $412,000
3
Beds
2
Baths
1,613
Sq Ft
$228/Sq Ft
Est. Value
About This Home
This home is located at 27 Hillcrest Dr, Pittsboro, NC 27312 and is currently estimated at $368,040, approximately $228 per square foot. 27 Hillcrest Dr is a home located in Chatham County with nearby schools including Pittsboro Elementary School, George Moses Horton Middle School, and Northwood High.
Ownership History
Date
Name
Owned For
Owner Type
Purchase Details
Closed on
Sep 1, 2016
Sold by
Verhoeven Rozemarijn
Bought by
Russell William R and Russell Bonnie J
Current Estimated Value
Home Financials for this Owner
Home Financials are based on the most recent Mortgage that was taken out on this home.
Original Mortgage
$199,000
Outstanding Balance
$162,605
Interest Rate
4.25%
Mortgage Type
Adjustable Rate Mortgage/ARM
Estimated Equity
$205,435
Purchase Details
Closed on
Aug 31, 2006
Sold by
Walker Robyn and Walker Christopher
Bought by
Verhoeven Rozemarijn
Home Financials for this Owner
Home Financials are based on the most recent Mortgage that was taken out on this home.
Original Mortgage
$156,500
Interest Rate
6.58%
Mortgage Type
Purchase Money Mortgage
Create a Home Valuation Report for This Property
The Home Valuation Report is an in-depth analysis detailing your home's value as well as a comparison with similar homes in the area
Home Values in the Area
Average Home Value in this Area
Purchase History
| Date | Buyer | Sale Price | Title Company |
|---|---|---|---|
| Russell William R | $199,000 | Attorney | |
| Verhoeven Rozemarijn | $156,500 | None Available |
Source: Public Records
Mortgage History
| Date | Status | Borrower | Loan Amount |
|---|---|---|---|
| Open | Russell William R | $199,000 | |
| Previous Owner | Verhoeven Rozemarijn | $156,500 |
Source: Public Records
Tax History Compared to Growth
Tax History
| Year | Tax Paid | Tax Assessment Tax Assessment Total Assessment is a certain percentage of the fair market value that is determined by local assessors to be the total taxable value of land and additions on the property. | Land | Improvement |
|---|---|---|---|---|
| 2025 | $3,762 | $338,190 | $45,450 | $292,740 |
| 2024 | $3,762 | $219,294 | $34,760 | $184,534 |
| 2023 | $2,790 | $219,294 | $34,760 | $184,534 |
| 2022 | $2,633 | $219,294 | $34,760 | $184,534 |
| 2021 | $2,609 | $219,294 | $34,760 | $184,534 |
| 2020 | $1,968 | $160,733 | $30,900 | $129,833 |
| 2019 | $1,958 | $160,733 | $30,900 | $129,833 |
| 2018 | $1,871 | $160,733 | $30,900 | $129,833 |
| 2017 | $1,871 | $160,733 | $30,900 | $129,833 |
| 2016 | $1,615 | $135,851 | $30,000 | $105,851 |
| 2015 | $1,597 | $135,751 | $30,000 | $105,751 |
| 2014 | $1,597 | $135,751 | $30,000 | $105,751 |
| 2013 | -- | $135,751 | $30,000 | $105,751 |
Source: Public Records
Map
Nearby Homes
- 425 Credle St
- 116 Kensington Dr
- 230 Oakwood Dr
- 54 Pattishall Rd
- 507 W Salisbury St
- 162 Gaines Trail
- 248 Ashford Dr
- 0 N Carolina 902
- 00 N Carolina 902
- 298 E Salisbury St
- 1157 Hillsboro St
- 66 Toomer Loop Rd
- 24 Cynthia Ln
- Tbd Versailles Ln
- 726 Thompson St
- 41 Cottage Way
- 17 Plenty Ct
- 186 Millennium Dr
- 25 Juleann Ln
- 142 Autumn Gate St