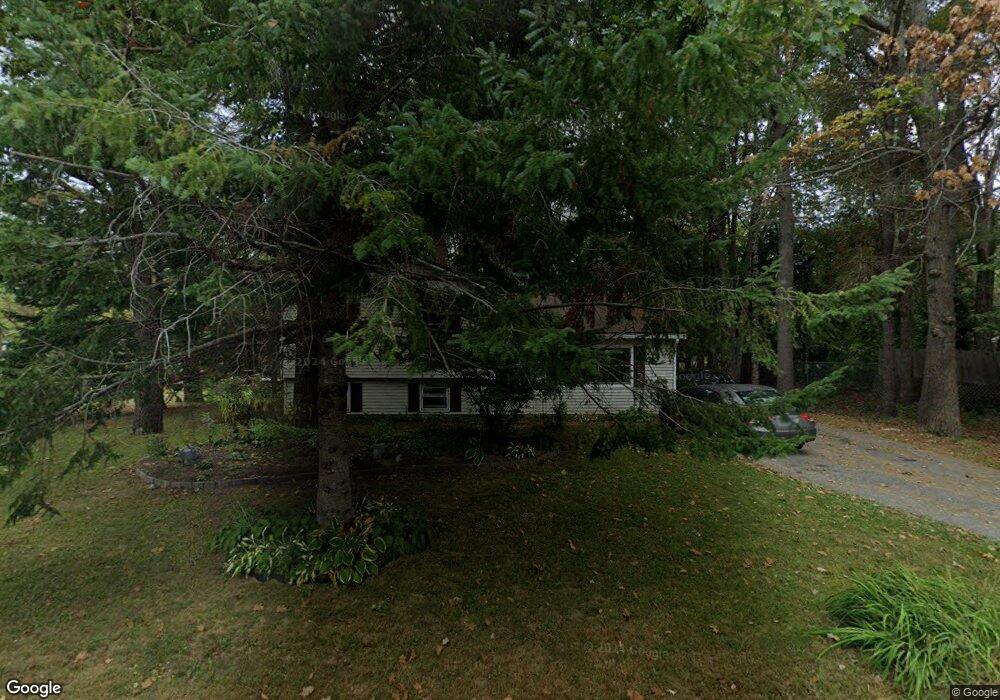
27 Huston St Lisbon, ME 04252
Estimated Value: $308,000 - $354,508
4
Beds
2
Baths
1,318
Sq Ft
$258/Sq Ft
Est. Value
About This Home
This home is located at 27 Huston St, Lisbon, ME 04252 and is currently estimated at $339,877, approximately $257 per square foot. 27 Huston St is a home located in Androscoggin County with nearby schools including Lisbon Community School, Philip W. Sugg Middle School, and Lisbon High School.
Ownership History
Date
Name
Owned For
Owner Type
Purchase Details
Closed on
Oct 15, 2012
Sold by
Us Bank Na
Bought by
Us Bank Na
Current Estimated Value
Purchase Details
Closed on
Jul 5, 2011
Sold by
Arata Amy B
Bought by
Cook Patricia M and Cook Ronald W
Home Financials for this Owner
Home Financials are based on the most recent Mortgage that was taken out on this home.
Original Mortgage
$144,530
Outstanding Balance
$99,947
Interest Rate
4.62%
Mortgage Type
Commercial
Estimated Equity
$239,930
Purchase Details
Closed on
Oct 13, 2010
Sold by
York Nancy G
Bought by
Us Bank Na
Create a Home Valuation Report for This Property
The Home Valuation Report is an in-depth analysis detailing your home's value as well as a comparison with similar homes in the area
Home Values in the Area
Average Home Value in this Area
Purchase History
| Date | Buyer | Sale Price | Title Company |
|---|---|---|---|
| Us Bank Na | -- | -- | |
| Cook Patricia M | -- | -- | |
| Us Bank Na | -- | -- |
Source: Public Records
Mortgage History
| Date | Status | Borrower | Loan Amount |
|---|---|---|---|
| Open | Cook Patricia M | $144,530 |
Source: Public Records
Tax History Compared to Growth
Tax History
| Year | Tax Paid | Tax Assessment Tax Assessment Total Assessment is a certain percentage of the fair market value that is determined by local assessors to be the total taxable value of land and additions on the property. | Land | Improvement |
|---|---|---|---|---|
| 2024 | $3,556 | $261,500 | $56,200 | $205,300 |
| 2023 | $3,243 | $153,700 | $37,100 | $116,600 |
| 2022 | $3,550 | $153,700 | $37,100 | $116,600 |
| 2021 | $3,397 | $153,700 | $37,100 | $116,600 |
| 2020 | $3,550 | $153,700 | $37,100 | $116,600 |
| 2019 | $3,550 | $153,700 | $37,100 | $116,600 |
| 2018 | $3,326 | $133,900 | $32,200 | $101,700 |
| 2017 | $3,106 | $133,900 | $32,200 | $101,700 |
| 2016 | $2,999 | $133,900 | $32,200 | $101,700 |
| 2015 | $2,696 | $123,000 | $35,200 | $87,800 |
| 2014 | $2,791 | $123,000 | $35,200 | $87,800 |
| 2013 | -- | $123,000 | $35,200 | $87,800 |
Source: Public Records
Map
Nearby Homes