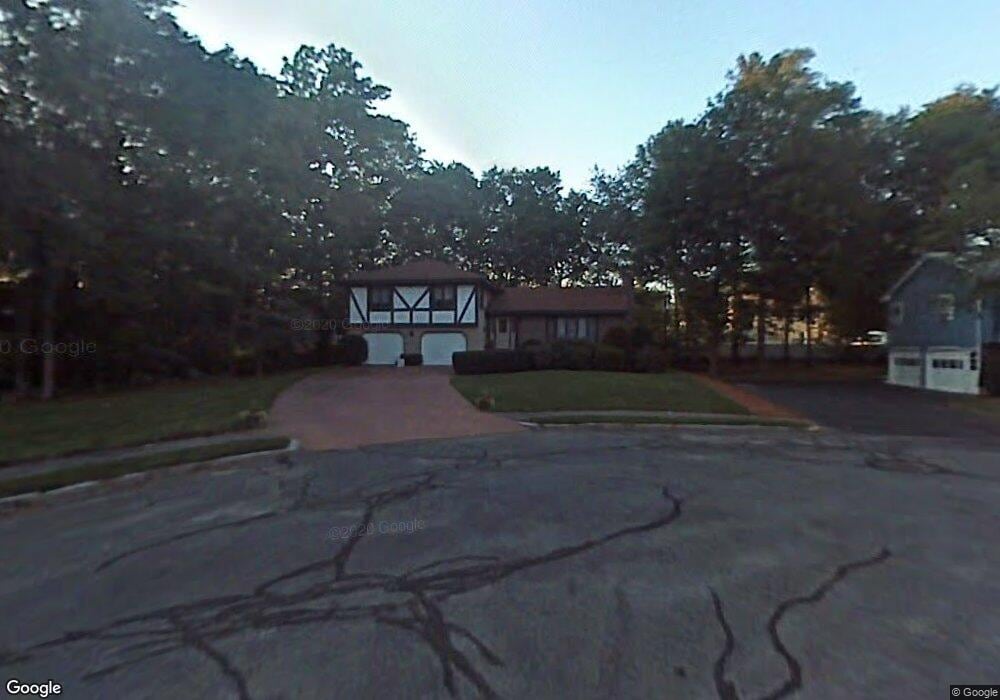
27 Jackson Ln Wakefield, MA 01880
Lakeside NeighborhoodEstimated Value: $886,000 - $972,000
3
Beds
3
Baths
2,470
Sq Ft
$380/Sq Ft
Est. Value
About This Home
This home is located at 27 Jackson Ln, Wakefield, MA 01880 and is currently estimated at $938,183, approximately $379 per square foot. 27 Jackson Ln is a home located in Middlesex County with nearby schools including Wakefield Memorial High School, St Joseph School, and Odyssey Day School.
Ownership History
Date
Name
Owned For
Owner Type
Purchase Details
Closed on
Oct 1, 2021
Sold by
Tarr Wayne M and Tarr Maryrose
Bought by
27 Jackson Ln Rt
Current Estimated Value
Purchase Details
Closed on
Sep 3, 1975
Bought by
Tarr Wayne M and Tarr Maryrose
Create a Home Valuation Report for This Property
The Home Valuation Report is an in-depth analysis detailing your home's value as well as a comparison with similar homes in the area
Home Values in the Area
Average Home Value in this Area
Purchase History
| Date | Buyer | Sale Price | Title Company |
|---|---|---|---|
| 27 Jackson Ln Rt | -- | None Available | |
| Tarr Wayne M | $11,300 | -- |
Source: Public Records
Mortgage History
| Date | Status | Borrower | Loan Amount |
|---|---|---|---|
| Previous Owner | Tarr Wayne M | $243,000 | |
| Previous Owner | Tarr Wayne M | $165,000 | |
| Previous Owner | Tarr Wayne M | $36,183 |
Source: Public Records
Tax History Compared to Growth
Tax History
| Year | Tax Paid | Tax Assessment Tax Assessment Total Assessment is a certain percentage of the fair market value that is determined by local assessors to be the total taxable value of land and additions on the property. | Land | Improvement |
|---|---|---|---|---|
| 2025 | $9,506 | $837,500 | $435,100 | $402,400 |
| 2024 | $8,765 | $779,100 | $404,700 | $374,400 |
| 2023 | $8,531 | $727,300 | $377,700 | $349,600 |
| 2022 | $8,002 | $649,500 | $337,200 | $312,300 |
| 2021 | $8,236 | $647,000 | $308,800 | $338,200 |
| 2020 | $7,745 | $606,500 | $289,500 | $317,000 |
| 2019 | $7,263 | $566,100 | $270,200 | $295,900 |
| 2018 | $4,023 | $540,800 | $258,100 | $282,700 |
| 2017 | $6,584 | $505,300 | $241,200 | $264,100 |
| 2016 | $6,406 | $474,900 | $238,300 | $236,600 |
| 2015 | $5,982 | $443,800 | $222,700 | $221,100 |
| 2014 | $5,501 | $430,400 | $217,200 | $213,200 |
Source: Public Records
Map
Nearby Homes
- 29 Cordis St
- 270 Lowell St
- 22 Wayland Rd
- 395 Vernon St
- 50 Quannapowitt Pkwy
- 16 Pleasant St
- 51 Crescent St
- 34 Cedar St
- 35 Richardson St Unit 2
- 410 Salem St Unit 1203
- 62 Foundry St Unit 310
- 62 Foundry St Unit 312
- 62 Foundry St Unit 412
- 62 Foundry St Unit 204
- 62 Foundry St Unit 309
- 62 Foundry St Unit 202
- 62 Foundry St Unit 208
- 62 Foundry St Unit 414
- 38 Bennett St Unit 3D
- 69 Foundry St Unit 310