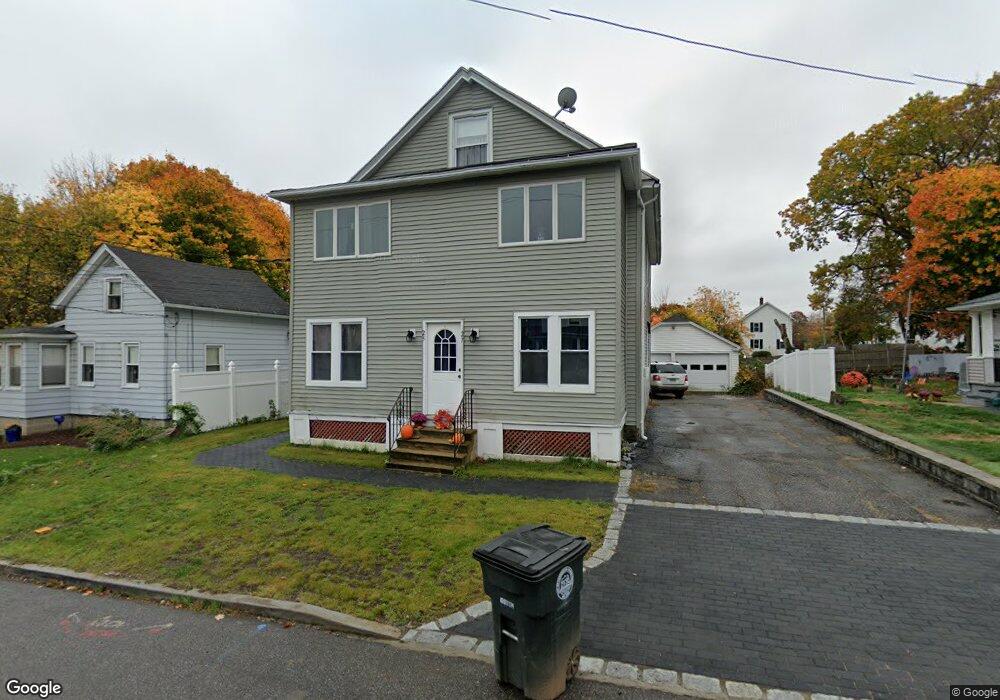
27 Jardon St Torrington, CT 06790
Estimated Value: $302,000 - $334,000
4
Beds
3
Baths
2,258
Sq Ft
$139/Sq Ft
Est. Value
About This Home
This home is located at 27 Jardon St, Torrington, CT 06790 and is currently estimated at $314,594, approximately $139 per square foot. 27 Jardon St is a home located in Litchfield County with nearby schools including Torrington Middle School, Torrington High School, and St. John Paul the Great Academy.
Ownership History
Date
Name
Owned For
Owner Type
Purchase Details
Closed on
Jan 23, 2012
Sold by
Thibodeau Neil J
Bought by
Dst Investments Llc
Current Estimated Value
Purchase Details
Closed on
Nov 16, 2011
Sold by
Perry George and Perry Shirley
Bought by
Thibodeau Neil J
Purchase Details
Closed on
May 3, 2006
Sold by
Horvath Imre and Herczeg Janos
Bought by
Perry Louis E and Perry George
Home Financials for this Owner
Home Financials are based on the most recent Mortgage that was taken out on this home.
Original Mortgage
$156,000
Interest Rate
8.3%
Purchase Details
Closed on
Apr 13, 2005
Sold by
Horvath Imre
Bought by
Horvath Imre and Herczeg Janos
Purchase Details
Closed on
Feb 26, 1999
Sold by
Clark Steven and Clark Anna
Bought by
Horvath Imre and Horvath Rozsa
Purchase Details
Closed on
Jun 22, 1994
Sold by
Gerwatowski Michael P
Bought by
Clark Steven and Clark Anna
Create a Home Valuation Report for This Property
The Home Valuation Report is an in-depth analysis detailing your home's value as well as a comparison with similar homes in the area
Home Values in the Area
Average Home Value in this Area
Purchase History
| Date | Buyer | Sale Price | Title Company |
|---|---|---|---|
| Dst Investments Llc | $125,000 | -- | |
| Thibodeau Neil J | $75,000 | -- | |
| Perry Louis E | $195,000 | -- | |
| Horvath Imre | $150,000 | -- | |
| Horvath Imre | $119,000 | -- | |
| Clark Steven | $60,000 | -- |
Source: Public Records
Mortgage History
| Date | Status | Borrower | Loan Amount |
|---|---|---|---|
| Open | Clark Steven | $245,000 | |
| Previous Owner | Clark Steven | $156,000 | |
| Previous Owner | Clark Steven | $39,000 |
Source: Public Records
Tax History Compared to Growth
Tax History
| Year | Tax Paid | Tax Assessment Tax Assessment Total Assessment is a certain percentage of the fair market value that is determined by local assessors to be the total taxable value of land and additions on the property. | Land | Improvement |
|---|---|---|---|---|
| 2025 | $7,813 | $203,210 | $20,370 | $182,840 |
| 2024 | $4,184 | $87,220 | $20,370 | $66,850 |
| 2023 | $4,183 | $87,220 | $20,370 | $66,850 |
| 2022 | $4,112 | $87,220 | $20,370 | $66,850 |
| 2021 | $4,027 | $87,220 | $20,370 | $66,850 |
| 2020 | $4,027 | $87,220 | $20,370 | $66,850 |
| 2019 | $3,665 | $79,380 | $20,370 | $59,010 |
| 2018 | $3,665 | $79,380 | $20,370 | $59,010 |
| 2017 | $3,632 | $79,380 | $20,370 | $59,010 |
| 2016 | $3,632 | $79,380 | $20,370 | $59,010 |
| 2015 | $3,632 | $79,380 | $20,370 | $59,010 |
| 2014 | $3,765 | $103,650 | $27,150 | $76,500 |
Source: Public Records
Map
Nearby Homes
- 775 Main St
- 187 Millard St
- 243 N Elm St
- 839 Main St Unit 65
- 839 Main St Unit 13
- 839 Main St Unit 91
- 839 Main St Unit 84
- 839 Main St Unit 96
- 375 N Elm St
- 0 Stoneridge Dr
- 115 Margerie St
- 17 Prospect Place
- 00 Winthrop St & E Elm St
- 482 Main St
- 35 Woodland Rd
- 168 Newfield Rd
- 146 Berry St
- 105 E Elm St
- 58 Berry St
- 199 Migeon Ave
- 33 Jardon St
- 19 Jardon St
- 39 Jardon St
- 169 Red Mountain Ave
- 165 Red Mountain Ave
- 47 Jardon St
- 36 Jardon St
- 28 Jardon St
- 187 Red Mountain Ave
- 189 Red Mountain Ave
- 34 Millard St
- 40 Millard St
- 157 Red Mountain Ave
- 44 Jardon St
- 22 Millard St
- 003 Red Mountain Ave
- 50 Millard St
- 203 Red Mountain Ave
- 55 Jardon St
- 52 Jardon St