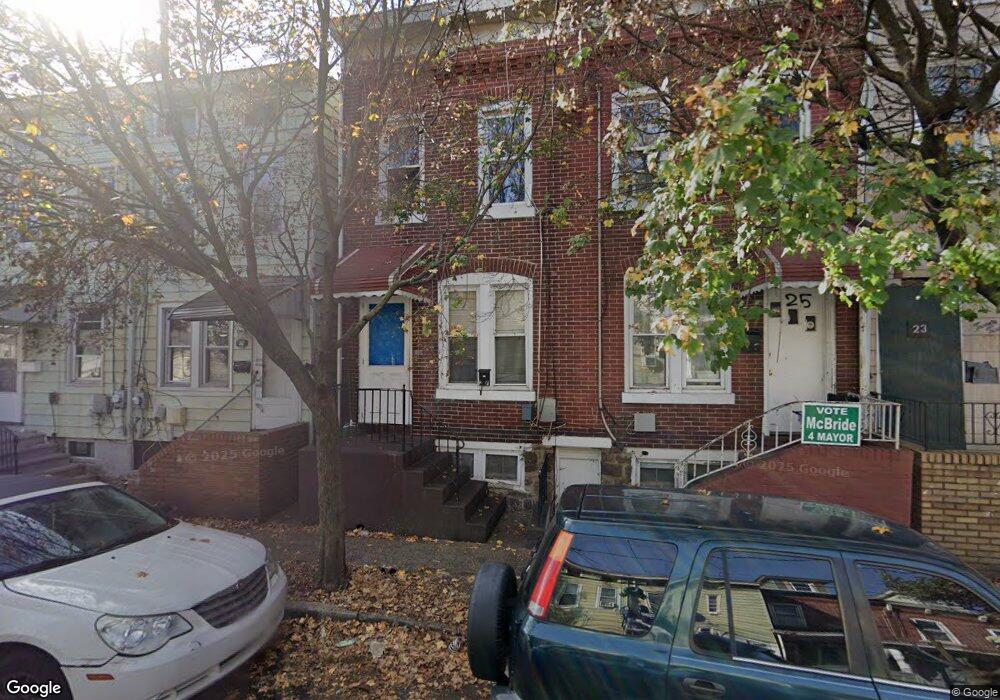
27 Jersey St Trenton, NJ 08611
South Trenton NeighborhoodEstimated Value: $114,861 - $161,000
--
Bed
--
Bath
828
Sq Ft
$164/Sq Ft
Est. Value
About This Home
This home is located at 27 Jersey St, Trenton, NJ 08611 and is currently estimated at $135,715, approximately $163 per square foot. 27 Jersey St is a home located in Mercer County with nearby schools including Mott Elementary School, Parker Elementary School, and Dr. Crosby Copeland Elementary School.
Ownership History
Date
Name
Owned For
Owner Type
Purchase Details
Closed on
Mar 22, 2023
Current Estimated Value
Purchase Details
Closed on
Jan 12, 2018
Sold by
Gindi Dani
Bought by
Dan Dan Real Llc
Purchase Details
Closed on
Aug 25, 2017
Sold by
Aponte Jose
Bought by
Gindi Dani
Purchase Details
Closed on
Jun 9, 2017
Sold by
Gabbi Moshe and Gerliz Yerachmiel
Bought by
Aponete Jose
Purchase Details
Closed on
May 1, 2012
Sold by
Berstone Equities Llc
Bought by
Gabbai Moshe
Purchase Details
Closed on
Dec 19, 2011
Sold by
Mcintosch Annmarie C
Bought by
Berstone Equities Llc
Create a Home Valuation Report for This Property
The Home Valuation Report is an in-depth analysis detailing your home's value as well as a comparison with similar homes in the area
Home Values in the Area
Average Home Value in this Area
Purchase History
| Date | Buyer | Sale Price | Title Company |
|---|---|---|---|
| -- | $35,000 | Emerald Title | |
| Redacted Upon Request | $35,000 | Emerald Title | |
| Dan Dan Real Llc | -- | Emerald Title Agency | |
| Gindi Dani | $28,000 | Multiple | |
| Aponete Jose | $16,000 | None Available | |
| Gabbai Moshe | $39,000 | None Available | |
| Berstone Equities Llc | $16,000 | Quick Title Search | |
| Berstone Equities Llc | $16,000 | Quick Title Search |
Source: Public Records
Tax History Compared to Growth
Tax History
| Year | Tax Paid | Tax Assessment Tax Assessment Total Assessment is a certain percentage of the fair market value that is determined by local assessors to be the total taxable value of land and additions on the property. | Land | Improvement |
|---|---|---|---|---|
| 2025 | $2,216 | $38,200 | $8,000 | $30,200 |
| 2024 | $2,127 | $38,200 | $8,000 | $30,200 |
| 2023 | $2,127 | $38,200 | $8,000 | $30,200 |
| 2022 | $2,085 | $38,200 | $8,000 | $30,200 |
| 2021 | $2,121 | $38,200 | $8,000 | $30,200 |
| 2020 | $2,114 | $38,200 | $8,000 | $30,200 |
| 2019 | $2,080 | $38,200 | $8,000 | $30,200 |
| 2018 | $1,991 | $38,200 | $8,000 | $30,200 |
| 2017 | $1,893 | $38,200 | $8,000 | $30,200 |
| 2016 | $2,261 | $39,300 | $14,700 | $24,600 |
| 2015 | $2,253 | $39,300 | $14,700 | $24,600 |
| 2014 | $2,242 | $39,300 | $14,700 | $24,600 |
Source: Public Records
Map
Nearby Homes