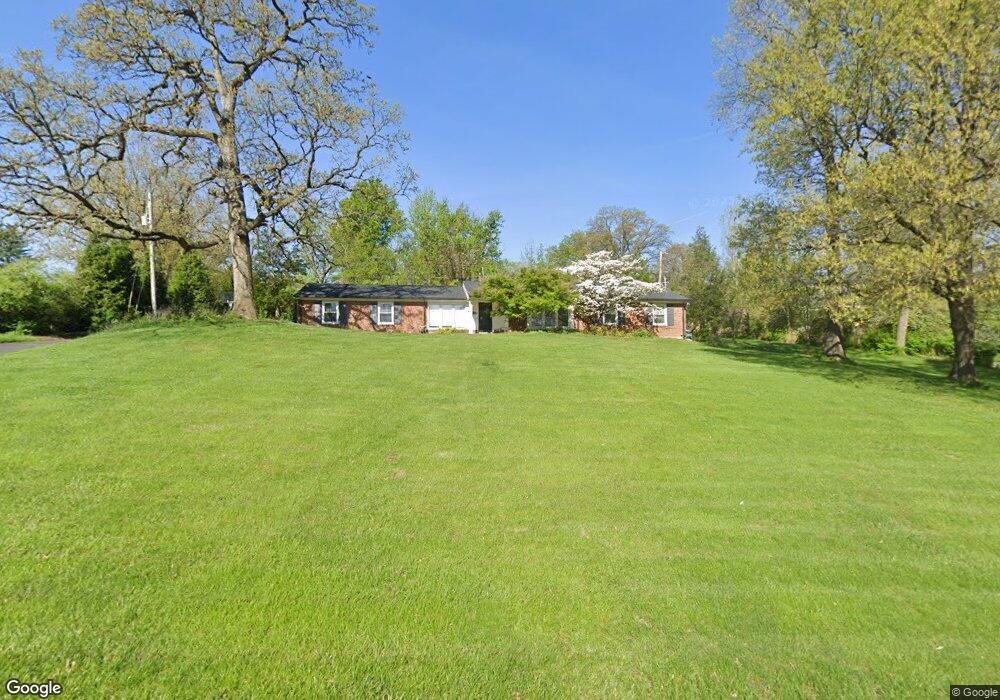
27 Ladue Estates Dr Saint Louis, MO 63141
Estimated Value: $676,833 - $917,000
4
Beds
3
Baths
2,326
Sq Ft
$339/Sq Ft
Est. Value
About This Home
This home is located at 27 Ladue Estates Dr, Saint Louis, MO 63141 and is currently estimated at $789,208, approximately $339 per square foot. 27 Ladue Estates Dr is a home located in St. Louis County with nearby schools including Ladue 5th Grade Center, Spoede Elementary School, and Ladue Middle.
Ownership History
Date
Name
Owned For
Owner Type
Purchase Details
Closed on
Sep 9, 2013
Sold by
Cedergreen Suellen M
Bought by
Sterman Eric and Sterman Kelly
Current Estimated Value
Home Financials for this Owner
Home Financials are based on the most recent Mortgage that was taken out on this home.
Original Mortgage
$200,000
Outstanding Balance
$51,194
Interest Rate
4.41%
Mortgage Type
New Conventional
Estimated Equity
$738,014
Purchase Details
Closed on
Oct 30, 1997
Sold by
Domke Fred M and Cedergreen Suellen M
Bought by
Cedergreen Suellen M
Purchase Details
Closed on
May 5, 1997
Sold by
Merman Cynthia H and Merman William L
Bought by
Domke Fred M and Cedergreen Suellen M
Home Financials for this Owner
Home Financials are based on the most recent Mortgage that was taken out on this home.
Original Mortgage
$190,750
Interest Rate
7.97%
Mortgage Type
Balloon
Create a Home Valuation Report for This Property
The Home Valuation Report is an in-depth analysis detailing your home's value as well as a comparison with similar homes in the area
Home Values in the Area
Average Home Value in this Area
Purchase History
| Date | Buyer | Sale Price | Title Company |
|---|---|---|---|
| Sterman Eric | $379,000 | Multiple | |
| Cedergreen Suellen M | -- | -- | |
| Domke Fred M | -- | -- |
Source: Public Records
Mortgage History
| Date | Status | Borrower | Loan Amount |
|---|---|---|---|
| Open | Sterman Eric | $200,000 | |
| Previous Owner | Domke Fred M | $190,750 |
Source: Public Records
Tax History Compared to Growth
Tax History
| Year | Tax Paid | Tax Assessment Tax Assessment Total Assessment is a certain percentage of the fair market value that is determined by local assessors to be the total taxable value of land and additions on the property. | Land | Improvement |
|---|---|---|---|---|
| 2025 | $8,171 | $142,230 | $109,040 | $33,190 |
| 2024 | $8,171 | $117,080 | $90,920 | $26,160 |
| 2023 | $8,161 | $117,080 | $90,920 | $26,160 |
| 2022 | $7,477 | $103,220 | $63,590 | $39,630 |
| 2021 | $7,420 | $103,220 | $63,590 | $39,630 |
| 2020 | $7,418 | $101,870 | $72,690 | $29,180 |
| 2019 | $7,290 | $101,870 | $72,690 | $29,180 |
| 2018 | $6,583 | $84,930 | $54,570 | $30,360 |
| 2017 | $6,573 | $84,930 | $54,570 | $30,360 |
| 2016 | $6,367 | $80,200 | $54,570 | $25,630 |
| 2015 | $6,075 | $80,200 | $54,570 | $25,630 |
| 2014 | $6,164 | $78,930 | $50,260 | $28,670 |
Source: Public Records
Map
Nearby Homes
- 111 N Mosley Rd
- 11239 Mosley Hill Dr
- 38 Ladue Meadows
- 241 S Graeser Rd
- 216 Townsend St
- 44 Villa Coublay
- 11563 Templar Dr
- 824 Bluespring Ln
- 12 Morwood Ln
- 526 Sarah Ln Unit 27
- 11906 Santino Ct
- 556 N Graeser Rd
- 514 Coeur de Royale Dr Unit 202
- 7 Westwood Country Club
- 11924 Santino Ct
- 5 Woodbridge Manor Rd
- 508 Coeur de Royale Dr Unit 301
- 578 Sarah Ln Unit 405
- 561 Sarah Ln Unit 204
- 561 Sarah Ln Unit 107
- 29 Ladue Estates Dr
- 2 Ladue Estates Dr
- 28 Ladue Estates Dr
- 4 Ladue Estates Dr
- 11201 Ladue Rd
- 30 Ladue Estates Dr
- 31 Ladue Estates Dr
- 11255 Ladue Rd
- 6 Ladue Estates Dr
- 55 Ladue Estates Dr
- 4 N Mosley Rd
- 55 E Ladue Estates Dr
- 1 Ladue Estates Dr
- 110 Mystic Meadows Ln
- 32 Ladue Estates Dr
- 3 Ladue Estates Dr
- 57 Ladue Estates Dr
- 121 Mystic Meadows Ln
- 108 N Mosley Rd
- 5 Ladue Estates Dr