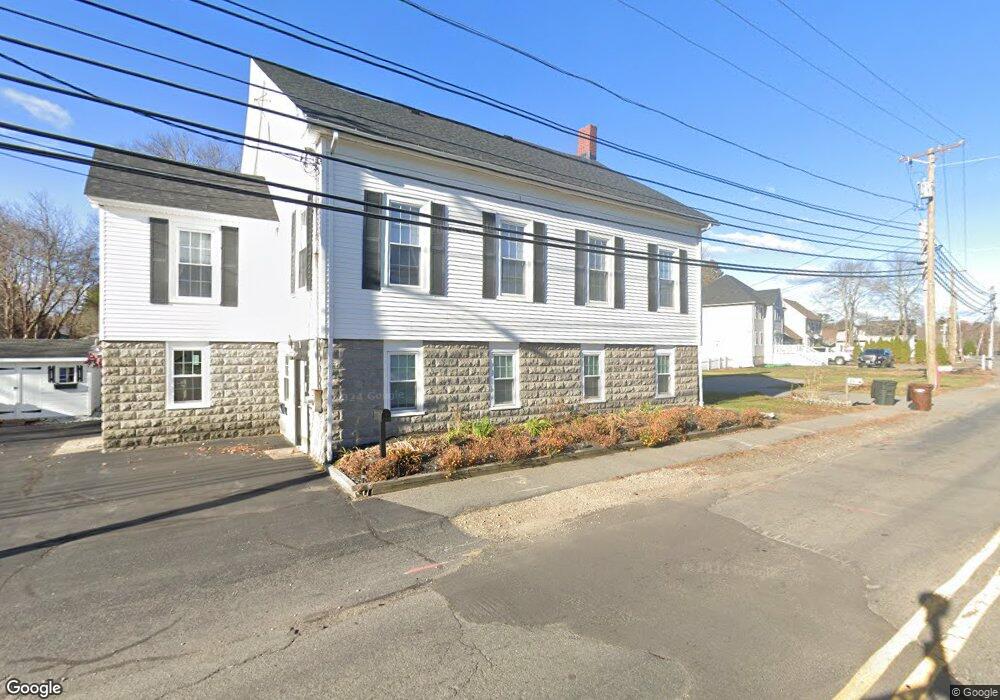
27 Lafayette Rd Salisbury, MA 01952
Estimated Value: $657,000 - $886,000
3
Beds
3
Baths
3,408
Sq Ft
$226/Sq Ft
Est. Value
About This Home
This home is located at 27 Lafayette Rd, Salisbury, MA 01952 and is currently estimated at $769,752, approximately $225 per square foot. 27 Lafayette Rd is a home located in Essex County with nearby schools including Triton Regional High School, River Valley Charter School, and Immaculate Conception School.
Ownership History
Date
Name
Owned For
Owner Type
Purchase Details
Closed on
Dec 12, 2014
Sold by
Davis William D
Bought by
Davis William D
Current Estimated Value
Purchase Details
Closed on
Mar 25, 2005
Sold by
H & M Ind Inc
Bought by
Davis William D
Purchase Details
Closed on
Oct 28, 2003
Sold by
Perrin Katherin T
Bought by
Davis William D
Home Financials for this Owner
Home Financials are based on the most recent Mortgage that was taken out on this home.
Original Mortgage
$335,250
Interest Rate
6.15%
Mortgage Type
Purchase Money Mortgage
Purchase Details
Closed on
Jan 11, 2002
Sold by
Laffely Ronald N and Laffely Sally A
Bought by
Perrin Katherin T
Create a Home Valuation Report for This Property
The Home Valuation Report is an in-depth analysis detailing your home's value as well as a comparison with similar homes in the area
Home Values in the Area
Average Home Value in this Area
Purchase History
| Date | Buyer | Sale Price | Title Company |
|---|---|---|---|
| Davis William D | -- | -- | |
| Davis William D | -- | -- | |
| Davis William D | $13,500 | -- | |
| Davis William D | $13,500 | -- | |
| Davis William D | $372,500 | -- | |
| Davis William D | $372,500 | -- | |
| Perrin Katherin T | $185,000 | -- | |
| Perrin Katherin T | $185,000 | -- |
Source: Public Records
Mortgage History
| Date | Status | Borrower | Loan Amount |
|---|---|---|---|
| Previous Owner | Perrin Katherin T | $30,000 | |
| Previous Owner | Perrin Katherin T | $335,250 |
Source: Public Records
Tax History
| Year | Tax Paid | Tax Assessment Tax Assessment Total Assessment is a certain percentage of the fair market value that is determined by local assessors to be the total taxable value of land and additions on the property. | Land | Improvement |
|---|---|---|---|---|
| 2025 | $7,045 | $698,900 | $159,000 | $539,900 |
| 2024 | $6,998 | $669,700 | $159,000 | $510,700 |
| 2023 | $6,133 | $567,900 | $159,000 | $408,900 |
| 2022 | $6,149 | $552,000 | $143,100 | $408,900 |
| 2021 | $6,142 | $545,500 | $143,100 | $402,400 |
| 2020 | $5,932 | $517,600 | $143,100 | $374,500 |
| 2019 | $5,682 | $479,100 | $139,100 | $340,000 |
| 2018 | $5,402 | $458,600 | $118,900 | $339,700 |
| 2017 | $4,907 | $411,700 | $114,700 | $297,000 |
| 2016 | $4,723 | $404,700 | $115,300 | $289,400 |
| 2015 | $4,425 | $376,600 | $107,300 | $269,300 |
Source: Public Records
Map
Nearby Homes
- 9 Meadowview Ln Unit A
- 14 Meadowview Ln Unit B
- 16 Meadowview Ln Unit B
- 2 True Rd
- 14 Seabrook Rd
- 48 Beach Rd Unit C
- 3 Lighthouse Cir Unit A
- 42 Kendell Ln
- 44 Seabrook Rd
- 6 Mason Ln
- 84 Forest Rd
- 154 Lafayette Rd
- 64 Seabrook Rd
- 135 Beach Rd Unit B114
- 100 Forest Rd
- 127 Beach Rd
- 34 Dock Ln
- 25 Bayberry Ln
- 86 Ferry Rd
- 7 Toll Rd
- 27 Lafayette Rd
- 29 Lafayette Rd Unit 2
- 29 Lafayette Rd Unit 1
- 29 Lafayette Rd
- 29 Lafayette Rd Unit B
- 29 Lafayette Rd Unit a
- 29 Lafayette Rd
- 1 Forest Rd
- 23 Lafayette Rd
- 23 Lafayette Rd
- 26 Lafayette Rd
- 31 Lafayette Rd
- 21 Lafayette Rd
- 2 Garafalo Dr
- 0 Forest Rd
- 0 Forest Rd Unit 72865253
- 22 Lafayette Rd Unit 1
- 22 Lafayette Rd
- 2 Forest Rd
- 33 Lafayette Rd
Your Personal Tour Guide
Ask me questions while you tour the home.