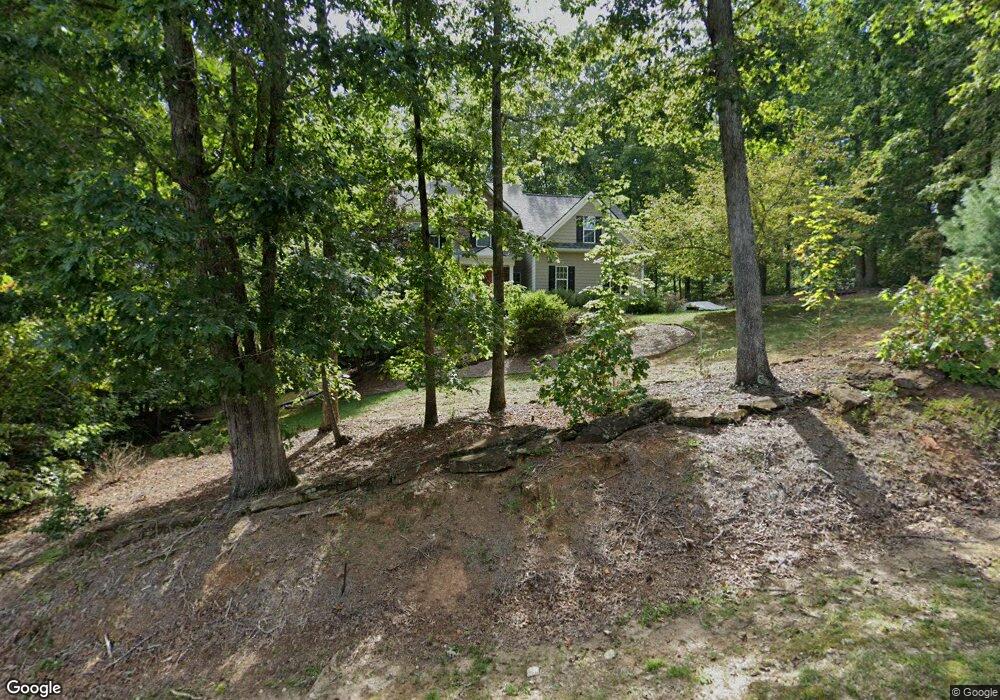
27 Lake Laurel Ct Dahlonega, GA 30533
Estimated Value: $450,470 - $564,000
4
Beds
3
Baths
2,500
Sq Ft
$207/Sq Ft
Est. Value
About This Home
This home is located at 27 Lake Laurel Ct, Dahlonega, GA 30533 and is currently estimated at $517,868, approximately $207 per square foot. 27 Lake Laurel Ct is a home located in Lumpkin County with nearby schools including Clay County Middle School and Lumpkin County High School.
Ownership History
Date
Name
Owned For
Owner Type
Purchase Details
Closed on
Jul 15, 2009
Sold by
Federal National Mortgage Assc
Bought by
Phipps Robert S and Phipps Marnie C
Current Estimated Value
Home Financials for this Owner
Home Financials are based on the most recent Mortgage that was taken out on this home.
Original Mortgage
$155,000
Outstanding Balance
$101,471
Interest Rate
5.37%
Mortgage Type
New Conventional
Estimated Equity
$416,397
Purchase Details
Closed on
Feb 3, 2009
Sold by
Wells Fargo Bank Na
Bought by
Federal National Mtg Associati
Purchase Details
Closed on
May 4, 2004
Sold by
Rymer Homes Inc
Bought by
Mitts Camille and Mitts Greg
Purchase Details
Closed on
Dec 19, 2003
Sold by
Rymer Development Llc
Bought by
Rymer Homes Inc
Purchase Details
Closed on
Mar 27, 2000
Bought by
Rymer Development Llc
Create a Home Valuation Report for This Property
The Home Valuation Report is an in-depth analysis detailing your home's value as well as a comparison with similar homes in the area
Home Values in the Area
Average Home Value in this Area
Purchase History
| Date | Buyer | Sale Price | Title Company |
|---|---|---|---|
| Phipps Robert S | -- | -- | |
| Federal National Mtg Associati | $179,083 | -- | |
| Wells Fargo Bank Na | $179,083 | -- | |
| Mitts Camille | $224,900 | -- | |
| Rymer Homes Inc | $44,000 | -- | |
| Rymer Development Llc | $500,700 | -- |
Source: Public Records
Mortgage History
| Date | Status | Borrower | Loan Amount |
|---|---|---|---|
| Open | Phipps Robert S | $155,000 |
Source: Public Records
Tax History Compared to Growth
Tax History
| Year | Tax Paid | Tax Assessment Tax Assessment Total Assessment is a certain percentage of the fair market value that is determined by local assessors to be the total taxable value of land and additions on the property. | Land | Improvement |
|---|---|---|---|---|
| 2024 | $3,786 | $164,960 | $10,000 | $154,960 |
| 2023 | $3,161 | $153,954 | $10,000 | $143,954 |
| 2022 | $3,197 | $131,142 | $10,000 | $121,142 |
| 2021 | $2,666 | $106,167 | $10,000 | $96,167 |
| 2020 | $2,673 | $103,313 | $10,000 | $93,313 |
| 2019 | $2,697 | $103,313 | $10,000 | $93,313 |
| 2018 | $2,547 | $91,763 | $10,000 | $81,763 |
| 2017 | $2,451 | $86,742 | $10,000 | $76,742 |
| 2016 | $2,319 | $79,530 | $10,000 | $69,530 |
| 2015 | $2,064 | $79,530 | $10,000 | $69,530 |
| 2014 | $2,064 | $80,302 | $10,000 | $70,302 |
| 2013 | -- | $81,075 | $10,000 | $71,075 |
Source: Public Records
Map
Nearby Homes
- 125 Lake Laurel Dr
- 162 Stoneridge Dr
- 75 Melody Ln
- 433 Elliots Ln
- 39 E Point Dr
- 6439 S Chestatee
- 6038 S Chestatee
- 6292 Timber Creek Trail
- 334 Silas Rd
- 391 Pinewood Place
- 459 Gold Ridge Rd
- 55 Flat Rock Pointe
- 0 Long Branch Rd Unit 10271720
- 0 Long Branch Rd Unit 10271266
- 0 Long Branch Rd Unit 7357871
- 00 Long Branch Rd
- 6266 Yellow Creek Rd
- 0 Eagle Rest Rd Unit 13519388
- 6278 Rufus Bryant Rd
- 307 Eagle Overlook Dr
- 0 Lake Laurel Ct N Unit 27 2845963
- 0 Lake Laurel Ct N Unit 27 7047113
- 0 Lake Laurel Ct N Unit 4051866
- 65 Lake Laurel Ct
- 75 Lake Laurel Ct Unit 2005
- 75 Lake Laurel Ct
- 123 Lake Laurel Trail
- 62 Lake Laurel Ct
- 24 Lake Laurel Ct
- 29 Lake Laurel Ct
- 85 Lake Laurel Trail
- 30 Lake Laurel Ct
- 100 Lake Laurel Trail
- 63 Lake Laurel Ct S
- 177 Lake Laurel Dr
- 137 Lake Laurel Dr
- 63 Lake Laurel Ct
- 259 Lake Laurel Dr
- 60 Lake Laurel Trail
- 197 Lake Laurel Dr