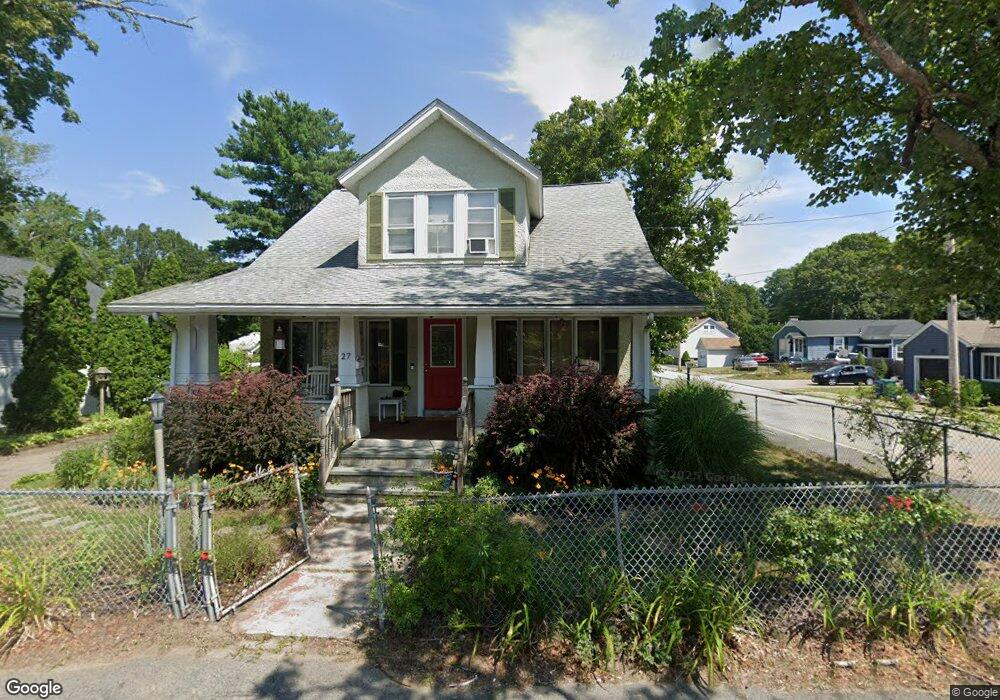
27 Lamb St Attleboro, MA 02703
Estimated Value: $473,109 - $541,000
3
Beds
2
Baths
1,598
Sq Ft
$311/Sq Ft
Est. Value
About This Home
This home is located at 27 Lamb St, Attleboro, MA 02703 and is currently estimated at $496,277, approximately $310 per square foot. 27 Lamb St is a home located in Bristol County with nearby schools including Peter Thacher Elementary School, Cyril K. Brennan Middle School, and Attleboro High School.
Ownership History
Date
Name
Owned For
Owner Type
Purchase Details
Closed on
Dec 23, 2005
Sold by
Lanaghan Patrick D and Lanaghan Tamara S J
Bought by
Reed Tobey
Current Estimated Value
Home Financials for this Owner
Home Financials are based on the most recent Mortgage that was taken out on this home.
Original Mortgage
$220,000
Interest Rate
6.36%
Mortgage Type
Purchase Money Mortgage
Purchase Details
Closed on
Aug 15, 2000
Sold by
Correia Aldina
Bought by
Lanaghan Patrick D and Lanaghan Tamara Sj
Home Financials for this Owner
Home Financials are based on the most recent Mortgage that was taken out on this home.
Original Mortgage
$124,000
Interest Rate
8.21%
Mortgage Type
Purchase Money Mortgage
Create a Home Valuation Report for This Property
The Home Valuation Report is an in-depth analysis detailing your home's value as well as a comparison with similar homes in the area
Home Values in the Area
Average Home Value in this Area
Purchase History
| Date | Buyer | Sale Price | Title Company |
|---|---|---|---|
| Reed Tobey | $275,000 | -- | |
| Lanaghan Patrick D | $155,000 | -- |
Source: Public Records
Mortgage History
| Date | Status | Borrower | Loan Amount |
|---|---|---|---|
| Open | Lanaghan Patrick D | $206,400 | |
| Closed | Reed Tobey | $220,000 | |
| Previous Owner | Lanaghan Patrick D | $122,500 | |
| Previous Owner | Lanaghan Patrick D | $124,000 | |
| Previous Owner | Lanaghan Patrick D | $47,000 |
Source: Public Records
Tax History
| Year | Tax Paid | Tax Assessment Tax Assessment Total Assessment is a certain percentage of the fair market value that is determined by local assessors to be the total taxable value of land and additions on the property. | Land | Improvement |
|---|---|---|---|---|
| 2025 | $4,987 | $397,400 | $117,500 | $279,900 |
| 2024 | $4,985 | $391,600 | $117,500 | $274,100 |
| 2023 | $4,774 | $348,700 | $106,700 | $242,000 |
| 2022 | $4,601 | $318,400 | $101,700 | $216,700 |
| 2021 | $2,839 | $282,900 | $97,700 | $185,200 |
| 2020 | $4,116 | $282,700 | $94,900 | $187,800 |
| 2019 | $2,777 | $269,800 | $93,100 | $176,700 |
| 2018 | $3,581 | $241,600 | $90,400 | $151,200 |
| 2017 | $4,179 | $243,600 | $90,400 | $153,200 |
| 2016 | $3,211 | $216,700 | $84,500 | $132,200 |
| 2015 | $2,851 | $193,800 | $84,500 | $109,300 |
| 2014 | $2,768 | $186,400 | $80,000 | $106,400 |
Source: Public Records
Map
Nearby Homes
- 95 Mulberry St
- 147 County St
- 1 Bellmore St
- 91 East St
- 17 Capron St
- 49 Dennis St
- 138 Fisher St Unit A
- 21 4th St
- 18-20 Jefferson St
- 61 Pine St Unit 9
- 17 Jewel Ave
- 75 Dennis St Unit 3
- 28 Pine St Unit C
- 64 Mechanic St Unit 3
- 64 Mechanic St
- 0 Rosedale Ln Unit 73469293
- 0 Joseph St Unit 73469304
- 0 Tulip Unit 73482326
- 0 Tulip Unit 73482330
- 0 Alvin St (Lot 501)
Your Personal Tour Guide
Ask me questions while you tour the home.