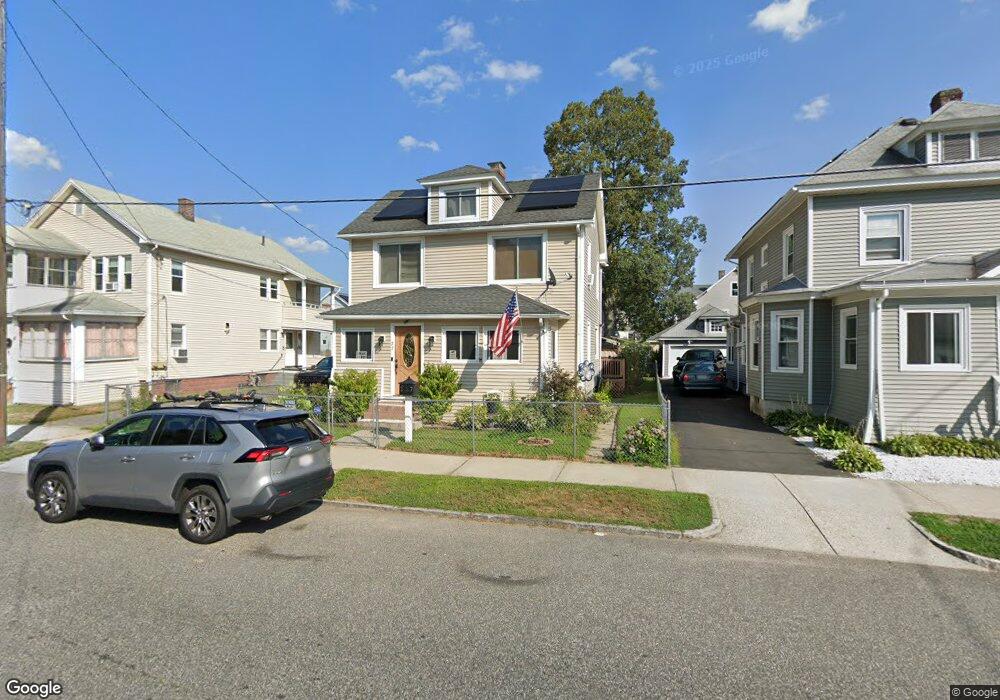
27 Langdon St Springfield, MA 01104
Liberty Heights NeighborhoodEstimated Value: $259,000 - $282,000
3
Beds
1
Bath
1,403
Sq Ft
$192/Sq Ft
Est. Value
About This Home
This home is located at 27 Langdon St, Springfield, MA 01104 and is currently estimated at $269,693, approximately $192 per square foot. 27 Langdon St is a home located in Hampden County with nearby schools including Glenwood School, Van Sickle Academy, and High School Of Commerce.
Ownership History
Date
Name
Owned For
Owner Type
Purchase Details
Closed on
May 16, 2008
Sold by
Rodriguez Julie M and Ludden Julie M
Bought by
Rodriguez Julie M
Current Estimated Value
Home Financials for this Owner
Home Financials are based on the most recent Mortgage that was taken out on this home.
Original Mortgage
$109,000
Outstanding Balance
$69,137
Interest Rate
5.91%
Mortgage Type
Purchase Money Mortgage
Estimated Equity
$200,556
Purchase Details
Closed on
May 7, 1998
Sold by
Labelle Emile J and Labelle Janice H
Bought by
Ludden Julie M and Rodriques Jose L
Home Financials for this Owner
Home Financials are based on the most recent Mortgage that was taken out on this home.
Original Mortgage
$61,468
Interest Rate
7.05%
Mortgage Type
Purchase Money Mortgage
Create a Home Valuation Report for This Property
The Home Valuation Report is an in-depth analysis detailing your home's value as well as a comparison with similar homes in the area
Home Values in the Area
Average Home Value in this Area
Purchase History
| Date | Buyer | Sale Price | Title Company |
|---|---|---|---|
| Rodriguez Julie M | -- | -- | |
| Ludden Julie M | $61,500 | -- |
Source: Public Records
Mortgage History
| Date | Status | Borrower | Loan Amount |
|---|---|---|---|
| Open | Rodriguez Julie M | $109,000 | |
| Previous Owner | Ludden Julie M | $61,468 | |
| Previous Owner | Ludden Julie M | $40,000 |
Source: Public Records
Tax History
| Year | Tax Paid | Tax Assessment Tax Assessment Total Assessment is a certain percentage of the fair market value that is determined by local assessors to be the total taxable value of land and additions on the property. | Land | Improvement |
|---|---|---|---|---|
| 2025 | $3,489 | $222,500 | $37,200 | $185,300 |
| 2024 | $3,546 | $220,800 | $37,200 | $183,600 |
| 2023 | $2,866 | $168,100 | $32,900 | $135,200 |
| 2022 | $3,085 | $163,900 | $30,800 | $133,100 |
| 2021 | $2,871 | $151,900 | $28,000 | $123,900 |
| 2020 | $2,883 | $147,600 | $28,000 | $119,600 |
| 2019 | $2,793 | $141,900 | $23,200 | $118,700 |
| 2018 | $2,375 | $120,700 | $23,200 | $97,500 |
| 2017 | $2,161 | $109,900 | $24,700 | $85,200 |
| 2016 | $2,402 | $122,200 | $24,700 | $97,500 |
| 2015 | $2,299 | $116,900 | $24,700 | $92,200 |
Source: Public Records
Map
Nearby Homes
- 118 Wait St
- 809 Carew St
- 744-746 Carew St
- 74 David St
- 708-710 Carew St
- 774-776 Liberty St
- 491-493 Newbury St
- 103 Ontario St
- 27 Parallel St
- 119 Littleton St
- 1078 Liberty St
- 151 Littleton St
- 571-573 Carew St
- 9 Utica St
- 150 Drexel St
- 59 Piedmont St
- 211-213 Chapin Terrace
- 7 Ledyard St
- 33 Drexel St
- 49 Upland St
- 31 Langdon St Unit 33
- 23 Langdon St
- 17-19 Langdon St
- 17-19 Langdon St Unit 2nd floor
- 30 Home St Unit 32
- 37 Langdon St Unit 39
- 17 Langdon St Unit 19
- 24 Home St Unit 26
- 24-26 Home St
- 36 Home St
- 20 Home St
- 40 Home St Unit 42
- 41 Langdon St Unit 43
- 41-43 Langdon St
- 28 Langdon St Unit 30
- 28 Langdon St Unit 1
- 11 Langdon St Unit 13
- 36 Langdon St
- 34 Langdon St Unit 36
- 20 Langdon St
Your Personal Tour Guide
Ask me questions while you tour the home.