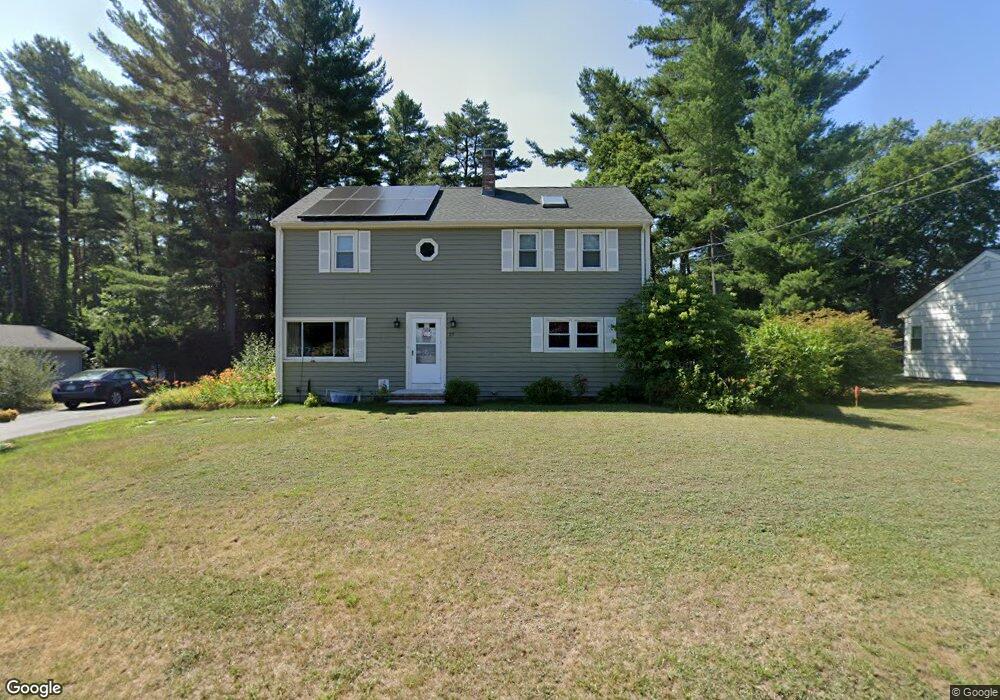
27 Leland St East Bridgewater, MA 02333
Estimated Value: $590,951 - $678,000
5
Beds
3
Baths
2,176
Sq Ft
$297/Sq Ft
Est. Value
About This Home
This home is located at 27 Leland St, East Bridgewater, MA 02333 and is currently estimated at $645,238, approximately $296 per square foot. 27 Leland St is a home located in Plymouth County with nearby schools including Gordon W Mitchell Middle School, East Bridgewater Jr./Sr. High School, and New Heights Charter School.
Ownership History
Date
Name
Owned For
Owner Type
Purchase Details
Closed on
Nov 15, 2007
Sold by
Larson Florence M
Bought by
Mills Roy A and Mills Rebecca R
Current Estimated Value
Home Financials for this Owner
Home Financials are based on the most recent Mortgage that was taken out on this home.
Original Mortgage
$260,000
Outstanding Balance
$164,759
Interest Rate
6.41%
Mortgage Type
Purchase Money Mortgage
Estimated Equity
$480,479
Purchase Details
Closed on
Oct 29, 2002
Sold by
Page Harry L and Page Amy L
Bought by
Larson Florence M
Home Financials for this Owner
Home Financials are based on the most recent Mortgage that was taken out on this home.
Original Mortgage
$252,000
Interest Rate
6.2%
Mortgage Type
Purchase Money Mortgage
Create a Home Valuation Report for This Property
The Home Valuation Report is an in-depth analysis detailing your home's value as well as a comparison with similar homes in the area
Home Values in the Area
Average Home Value in this Area
Purchase History
| Date | Buyer | Sale Price | Title Company |
|---|---|---|---|
| Mills Roy A | $331,225 | -- | |
| Larson Florence M | $315,000 | -- |
Source: Public Records
Mortgage History
| Date | Status | Borrower | Loan Amount |
|---|---|---|---|
| Open | Larson Florence M | $260,000 | |
| Previous Owner | Larson Florence M | $310,000 | |
| Previous Owner | Larson Florence M | $252,000 |
Source: Public Records
Tax History Compared to Growth
Tax History
| Year | Tax Paid | Tax Assessment Tax Assessment Total Assessment is a certain percentage of the fair market value that is determined by local assessors to be the total taxable value of land and additions on the property. | Land | Improvement |
|---|---|---|---|---|
| 2025 | $5,975 | $437,100 | $173,200 | $263,900 |
| 2024 | $5,883 | $425,100 | $166,600 | $258,500 |
| 2023 | $5,833 | $403,700 | $166,600 | $237,100 |
| 2022 | $5,680 | $364,100 | $151,500 | $212,600 |
| 2021 | $5,676 | $332,900 | $145,600 | $187,300 |
| 2020 | $5,640 | $326,200 | $140,000 | $186,200 |
| 2019 | $6,900 | $317,100 | $133,800 | $183,300 |
| 2018 | $5,460 | $304,000 | $133,800 | $170,200 |
| 2017 | $4,732 | $290,100 | $127,600 | $162,500 |
| 2016 | $5,203 | $286,500 | $127,600 | $158,900 |
| 2015 | $5,058 | $284,800 | $126,700 | $158,100 |
| 2014 | $4,864 | $280,000 | $124,100 | $155,900 |
Source: Public Records
Map
Nearby Homes