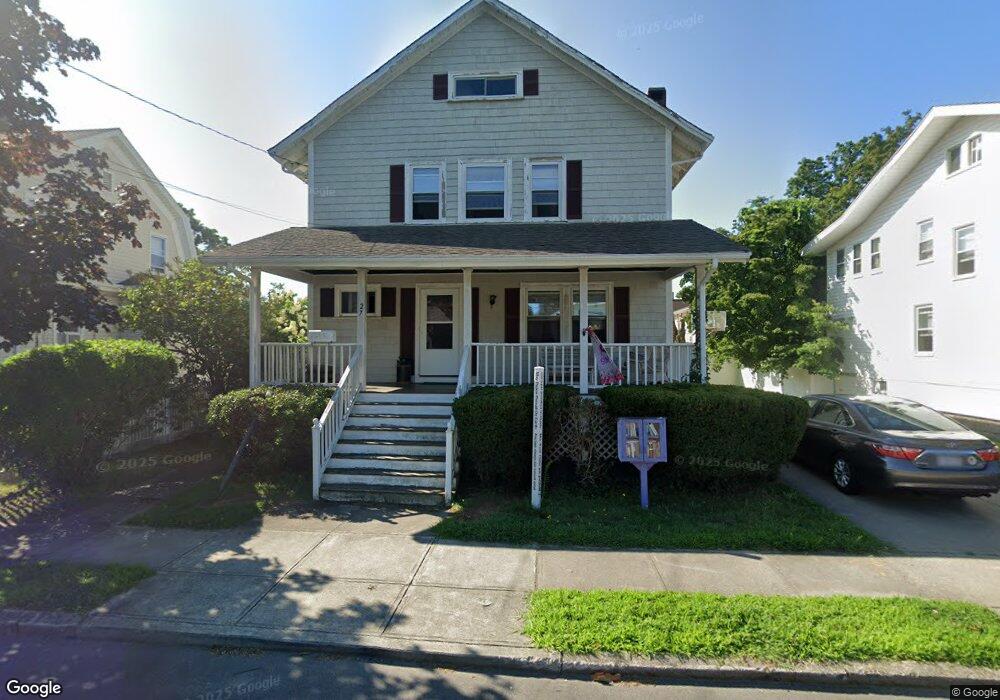
27 Linden Ave Fairhaven, MA 02719
Oxford NeighborhoodEstimated Value: $470,000 - $549,000
4
Beds
2
Baths
1,764
Sq Ft
$290/Sq Ft
Est. Value
About This Home
This home is located at 27 Linden Ave, Fairhaven, MA 02719 and is currently estimated at $510,902, approximately $289 per square foot. 27 Linden Ave is a home located in Bristol County with nearby schools including Fairhaven High School, City On A Hill Charter Public School New Bedford, and St. Joseph School.
Ownership History
Date
Name
Owned For
Owner Type
Purchase Details
Closed on
Sep 10, 2020
Sold by
Murphy-Mello Maureen and Mello Thomas M
Bought by
Mello Thomas M and Mello Maureen
Current Estimated Value
Purchase Details
Closed on
Jul 22, 2005
Sold by
Murphy Carolyn J and Murphy James E
Bought by
Mello Maureen Murphy and Mello Thomas M
Home Financials for this Owner
Home Financials are based on the most recent Mortgage that was taken out on this home.
Original Mortgage
$220,000
Interest Rate
5.59%
Mortgage Type
Purchase Money Mortgage
Create a Home Valuation Report for This Property
The Home Valuation Report is an in-depth analysis detailing your home's value as well as a comparison with similar homes in the area
Home Values in the Area
Average Home Value in this Area
Purchase History
| Date | Buyer | Sale Price | Title Company |
|---|---|---|---|
| Mello Thomas M | -- | None Available | |
| Mello Maureen Murphy | $275,000 | -- |
Source: Public Records
Mortgage History
| Date | Status | Borrower | Loan Amount |
|---|---|---|---|
| Previous Owner | Mello Maureen Murphy | $220,000 | |
| Previous Owner | Mello Maureen Murphy | $18,000 | |
| Previous Owner | Mello Maureen Murphy | $20,000 |
Source: Public Records
Tax History
| Year | Tax Paid | Tax Assessment Tax Assessment Total Assessment is a certain percentage of the fair market value that is determined by local assessors to be the total taxable value of land and additions on the property. | Land | Improvement |
|---|---|---|---|---|
| 2025 | $39 | $420,800 | $168,700 | $252,100 |
| 2024 | $3,782 | $409,800 | $168,700 | $241,100 |
| 2023 | $3,712 | $373,100 | $147,800 | $225,300 |
| 2022 | $3,611 | $353,300 | $137,300 | $216,000 |
| 2021 | $3,429 | $303,700 | $124,200 | $179,500 |
| 2020 | $3,343 | $302,300 | $124,200 | $178,100 |
| 2019 | $3,114 | $266,800 | $103,000 | $163,800 |
| 2018 | $2,992 | $254,100 | $98,100 | $156,000 |
| 2017 | $2,927 | $243,100 | $98,100 | $145,000 |
| 2016 | $2,809 | $230,600 | $98,100 | $132,500 |
| 2015 | $2,771 | $228,100 | $98,100 | $130,000 |
Source: Public Records
Map
Nearby Homes
- 24 Academy Ave
- 138 Main St Unit 13
- 16 Ash St
- 67 Bridge St
- 15 School St
- 39 Christian St
- 77 Adams St
- 0 Nulands Neck Unit 73286360
- 8 Washington St
- 442 Dana Farms
- 58 Washington St
- 145 Pleasant St
- 24 Middle St
- 313 Main St
- 14 Sycamore St
- 253 Adams St
- 10 Livesey Pkwy
- 181 Washington St
- 71 Sycamore St
- 8 Manor Dr
Your Personal Tour Guide
Ask me questions while you tour the home.