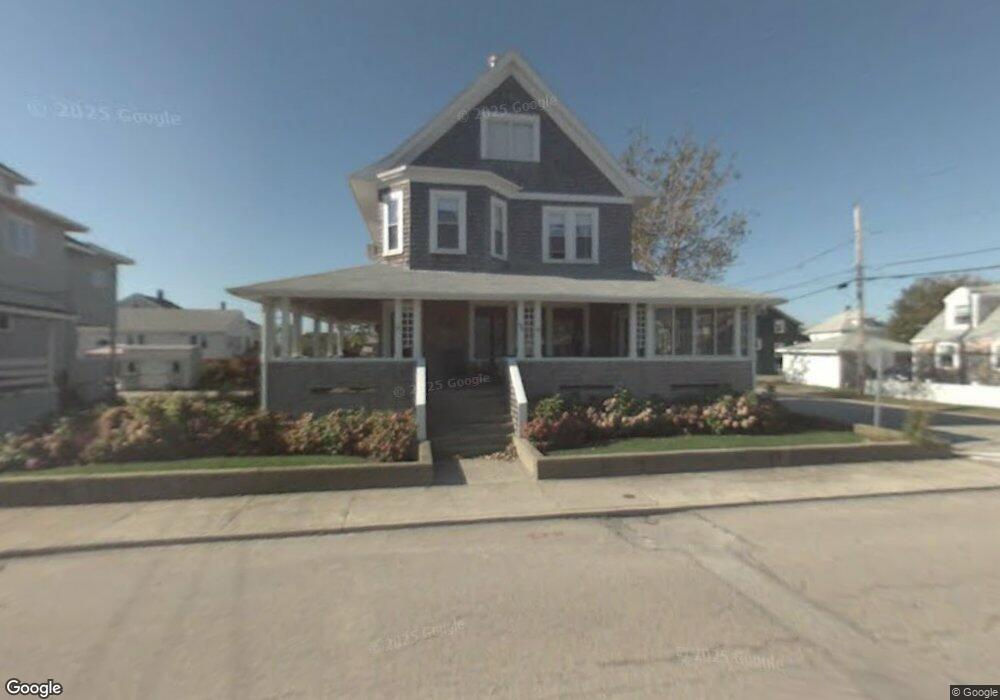
27 Manomet Ave Unit 1 Hull, MA 02045
Whitehead NeighborhoodEstimated Value: $1,315,000 - $1,785,000
5
Beds
3
Baths
1,884
Sq Ft
$814/Sq Ft
Est. Value
About This Home
This home is located at 27 Manomet Ave Unit 1, Hull, MA 02045 and is currently estimated at $1,534,311, approximately $814 per square foot. 27 Manomet Ave Unit 1 is a home located in Plymouth County with nearby schools including Lillian M. Jacobs Elementary School, Memorial Middle School, and Hull High School.
Ownership History
Date
Name
Owned For
Owner Type
Purchase Details
Closed on
Aug 26, 2011
Sold by
Berluti James A and Berluti Carolyn S
Bought by
Oconnor Thomas D and Oconnor Nancy B
Current Estimated Value
Purchase Details
Closed on
Oct 16, 2002
Sold by
Kent Thomas and Kent Jane
Bought by
Berluti James A and Berluti Carolyn S
Home Financials for this Owner
Home Financials are based on the most recent Mortgage that was taken out on this home.
Original Mortgage
$480,000
Interest Rate
6.18%
Mortgage Type
Purchase Money Mortgage
Purchase Details
Closed on
Sep 1, 2000
Sold by
Krantz Treva J and Lapotin Barbara J
Bought by
Kent Thomas and Kent Jane
Purchase Details
Closed on
Dec 10, 1991
Sold by
Randon Rt
Bought by
Krantz Treva J and Lapotin Barbara J
Purchase Details
Closed on
May 13, 1987
Sold by
Gartley Susan H
Bought by
Randon Rt
Create a Home Valuation Report for This Property
The Home Valuation Report is an in-depth analysis detailing your home's value as well as a comparison with similar homes in the area
Home Values in the Area
Average Home Value in this Area
Purchase History
| Date | Buyer | Sale Price | Title Company |
|---|---|---|---|
| Oconnor Thomas D | $572,500 | -- | |
| Berluti James A | $600,000 | -- | |
| Kent Thomas | $400,000 | -- | |
| Krantz Treva J | $150,000 | -- | |
| Krantz Treva J | $150,000 | -- | |
| Randon Rt | $155,000 | -- |
Source: Public Records
Mortgage History
| Date | Status | Borrower | Loan Amount |
|---|---|---|---|
| Previous Owner | Randon Rt | $455,600 | |
| Previous Owner | Randon Rt | $480,000 |
Source: Public Records
Tax History Compared to Growth
Tax History
| Year | Tax Paid | Tax Assessment Tax Assessment Total Assessment is a certain percentage of the fair market value that is determined by local assessors to be the total taxable value of land and additions on the property. | Land | Improvement |
|---|---|---|---|---|
| 2025 | $15,429 | $1,377,600 | $489,900 | $887,700 |
| 2024 | $15,133 | $1,299,000 | $452,200 | $846,800 |
| 2023 | $13,370 | $1,098,600 | $376,800 | $721,800 |
| 2022 | $9,583 | $764,200 | $286,400 | $477,800 |
| 2021 | $9,624 | $759,000 | $286,400 | $472,600 |
| 2020 | $8,961 | $699,000 | $286,400 | $412,600 |
| 2019 | $8,569 | $656,600 | $256,200 | $400,400 |
| 2018 | $8,158 | $607,900 | $256,200 | $351,700 |
| 2017 | $8,007 | $583,600 | $256,200 | $327,400 |
| 2016 | $7,867 | $583,600 | $256,200 | $327,400 |
| 2015 | $7,681 | $551,000 | $226,100 | $324,900 |
| 2014 | $7,642 | $551,000 | $226,100 | $324,900 |
Source: Public Records
Map
Nearby Homes
- 27 Manomet Ave
- 27 Manomet Ave Short Term Unit 1
- 27 Manomet Ave Summer Rental Unit 1
- 25 Manomet Ave
- 29 Manomet Ave
- 24 Malta St
- 23 Manomet Ave
- 5 Harvey Place
- 30 Malta St
- 26 Manomet Ave
- 26 Manomet Ave Unit hse- summer
- 26 Manomet Ave Unit House
- 3 Harvey Place
- 23 Malta St
- 32 Malta St
- 31 Manomet Ave
- 29 Malta St
- 24 Manomet Ave
- 21 Manomet Ave
- 38 Samoset Ave