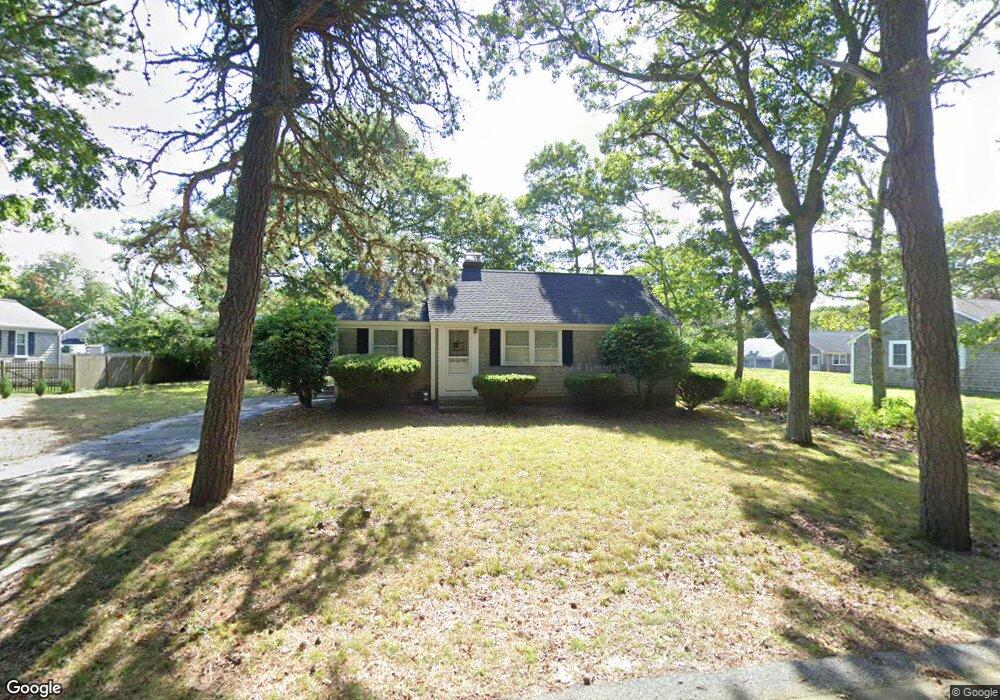
27 Mari Jane Rd West Dennis, MA 02670
West Dennis NeighborhoodEstimated Value: $543,759 - $602,000
3
Beds
1
Bath
892
Sq Ft
$642/Sq Ft
Est. Value
About This Home
This home is located at 27 Mari Jane Rd, West Dennis, MA 02670 and is currently estimated at $572,440, approximately $641 per square foot. 27 Mari Jane Rd is a home located in Barnstable County with nearby schools including Dennis-Yarmouth Regional High School and St. Pius X. School.
Ownership History
Date
Name
Owned For
Owner Type
Purchase Details
Closed on
Apr 30, 2002
Sold by
Miller Gerard R
Bought by
Doria Daniel A and Delahanty Jean L
Current Estimated Value
Home Financials for this Owner
Home Financials are based on the most recent Mortgage that was taken out on this home.
Original Mortgage
$110,000
Outstanding Balance
$46,841
Interest Rate
7.05%
Mortgage Type
Purchase Money Mortgage
Estimated Equity
$525,599
Purchase Details
Closed on
Nov 2, 2000
Sold by
Granfield Patrick E and Granfield Priscilla J
Bought by
Miller Gerard R
Home Financials for this Owner
Home Financials are based on the most recent Mortgage that was taken out on this home.
Original Mortgage
$126,350
Interest Rate
7.83%
Mortgage Type
Purchase Money Mortgage
Create a Home Valuation Report for This Property
The Home Valuation Report is an in-depth analysis detailing your home's value as well as a comparison with similar homes in the area
Home Values in the Area
Average Home Value in this Area
Purchase History
| Date | Buyer | Sale Price | Title Company |
|---|---|---|---|
| Doria Daniel A | $197,000 | -- | |
| Miller Gerard R | $133,500 | -- |
Source: Public Records
Mortgage History
| Date | Status | Borrower | Loan Amount |
|---|---|---|---|
| Open | Doria Daniel A | $110,000 | |
| Previous Owner | Miller Gerard R | $126,350 |
Source: Public Records
Tax History Compared to Growth
Tax History
| Year | Tax Paid | Tax Assessment Tax Assessment Total Assessment is a certain percentage of the fair market value that is determined by local assessors to be the total taxable value of land and additions on the property. | Land | Improvement |
|---|---|---|---|---|
| 2025 | $2,070 | $478,000 | $220,400 | $257,600 |
| 2024 | $1,927 | $439,000 | $211,900 | $227,100 |
| 2023 | $1,864 | $399,100 | $192,700 | $206,400 |
| 2022 | $1,690 | $301,700 | $150,400 | $151,300 |
| 2021 | $3,568 | $271,300 | $147,500 | $123,800 |
| 2020 | $1,654 | $271,100 | $158,800 | $112,300 |
| 2019 | $1,662 | $269,400 | $166,800 | $102,600 |
| 2018 | $3,082 | $241,400 | $148,200 | $93,200 |
| 2017 | $3,308 | $238,400 | $148,200 | $90,200 |
| 2016 | $1,493 | $228,700 | $153,500 | $75,200 |
| 2015 | $1,464 | $228,700 | $153,500 | $75,200 |
| 2014 | $1,452 | $228,700 | $153,500 | $75,200 |
Source: Public Records
Map
Nearby Homes
- 61 Trotters Ln
- 15 Woodside Park Rd
- 467 Main St
- 401 Main St Unit 201
- 401 Main St Unit 101
- 3 Pinefield Ln
- 12 Spoonbill Rd
- 26 Center St
- 178 School St
- 23 Doric Ave
- 80 Michaels Ave
- 95 Center St
- 209 Main St Unit 3
- 209 Main St Unit 6
- 209 Main St Unit 1
- 209 Main St Unit 2
- 209 Main St Unit 4
- 209 Main St Unit 5
- 14 Schoolhouse Ln
- 71 Main St