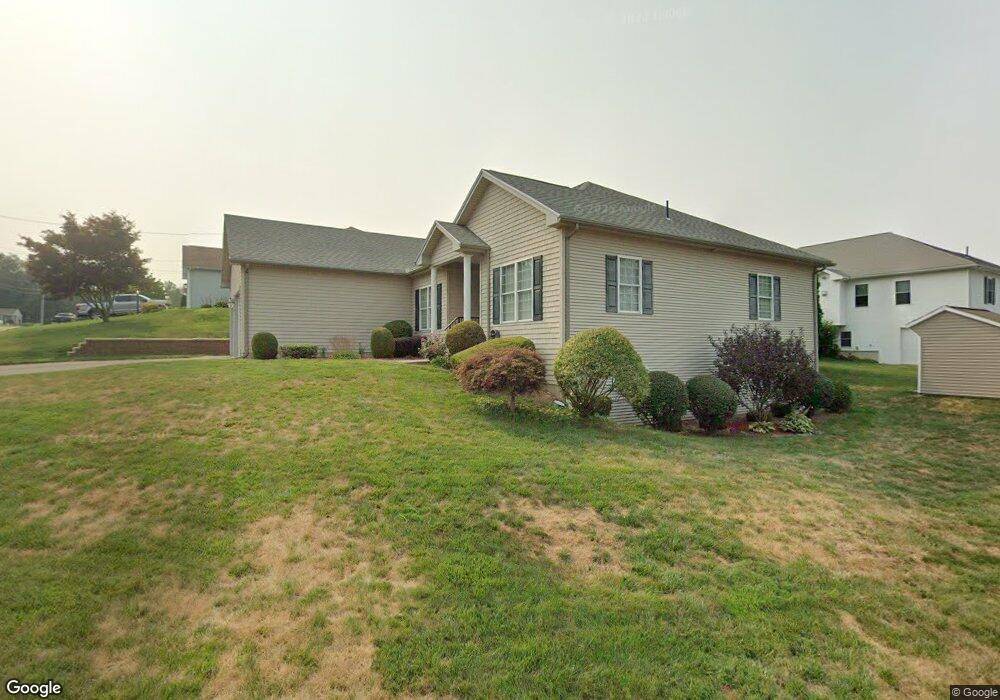
27 Mayer Dr Holyoke, MA 01040
Estimated Value: $445,000 - $536,000
3
Beds
2
Baths
2,134
Sq Ft
$232/Sq Ft
Est. Value
About This Home
This home is located at 27 Mayer Dr, Holyoke, MA 01040 and is currently estimated at $495,117, approximately $232 per square foot. 27 Mayer Dr is a home located in Hampden County with nearby schools including Lt. Elmer J. McMahon Elementary School, Holyoke High School, and Holyoke Community Charter School.
Ownership History
Date
Name
Owned For
Owner Type
Purchase Details
Closed on
Mar 21, 2022
Sold by
Mitrowski Robert E and Mitrowski June E
Bought by
Mitrowski Robert E and Szatrowski Lynn A
Current Estimated Value
Purchase Details
Closed on
Mar 9, 2022
Sold by
Mitrowski Robert E and Mitrowski June E
Bought by
Mitrowski Robert E and Erickson Patricia M
Purchase Details
Closed on
Mar 31, 2006
Sold by
Home Improvement Assoc and Tabin
Bought by
Mitrowski June E and Mitrowski Robert E
Purchase Details
Closed on
Oct 24, 2005
Sold by
Cauley Edward J and Tabin Alan J
Bought by
Home Improve As Llc and Tabin
Home Financials for this Owner
Home Financials are based on the most recent Mortgage that was taken out on this home.
Original Mortgage
$268,000
Interest Rate
5.72%
Mortgage Type
Purchase Money Mortgage
Create a Home Valuation Report for This Property
The Home Valuation Report is an in-depth analysis detailing your home's value as well as a comparison with similar homes in the area
Home Values in the Area
Average Home Value in this Area
Purchase History
| Date | Buyer | Sale Price | Title Company |
|---|---|---|---|
| Mitrowski Robert E | -- | None Available | |
| Mitrowski Robert E | -- | None Available | |
| Mitrowski June E | $335,000 | -- | |
| Home Improve As Llc | $59,285 | -- |
Source: Public Records
Mortgage History
| Date | Status | Borrower | Loan Amount |
|---|---|---|---|
| Previous Owner | Home Improve As Llc | $268,000 |
Source: Public Records
Tax History Compared to Growth
Tax History
| Year | Tax Paid | Tax Assessment Tax Assessment Total Assessment is a certain percentage of the fair market value that is determined by local assessors to be the total taxable value of land and additions on the property. | Land | Improvement |
|---|---|---|---|---|
| 2025 | $8,288 | $474,700 | $71,000 | $403,700 |
| 2024 | $7,931 | $418,500 | $67,700 | $350,800 |
| 2023 | $7,560 | $403,000 | $67,700 | $335,300 |
| 2022 | $7,111 | $369,200 | $67,700 | $301,500 |
| 2021 | $6,800 | $352,900 | $65,100 | $287,800 |
| 2020 | $6,420 | $336,500 | $65,100 | $271,400 |
| 2019 | $47 | $323,200 | $65,100 | $258,100 |
| 2018 | $5,926 | $309,800 | $65,100 | $244,700 |
| 2017 | $5,939 | $309,800 | $65,100 | $244,700 |
| 2016 | $5,835 | $305,200 | $67,000 | $238,200 |
| 2015 | $5,811 | $305,200 | $67,000 | $238,200 |
Source: Public Records
Map
Nearby Homes
- 794 Homestead Ave
- lot b Homestead Ave
- 695 Homestead Ave
- Lot A Homestead Ave
- 53 Farnum Dr Unit 53
- 12 Gordon Dr
- 286 Westfield Rd
- 85 Woodland St
- 84 Woodland St
- 244 Ontario Ave
- 89-111 Whitney Ave
- 958 Main St
- 934 Main St
- 25 W Glen St
- 128 Ontario Ave
- 78 Hitchcock St
- 33 Bonner St
- 70-72 Westfield Rd
- 9 Prew Ave Unit 4A
- 24 Daley St