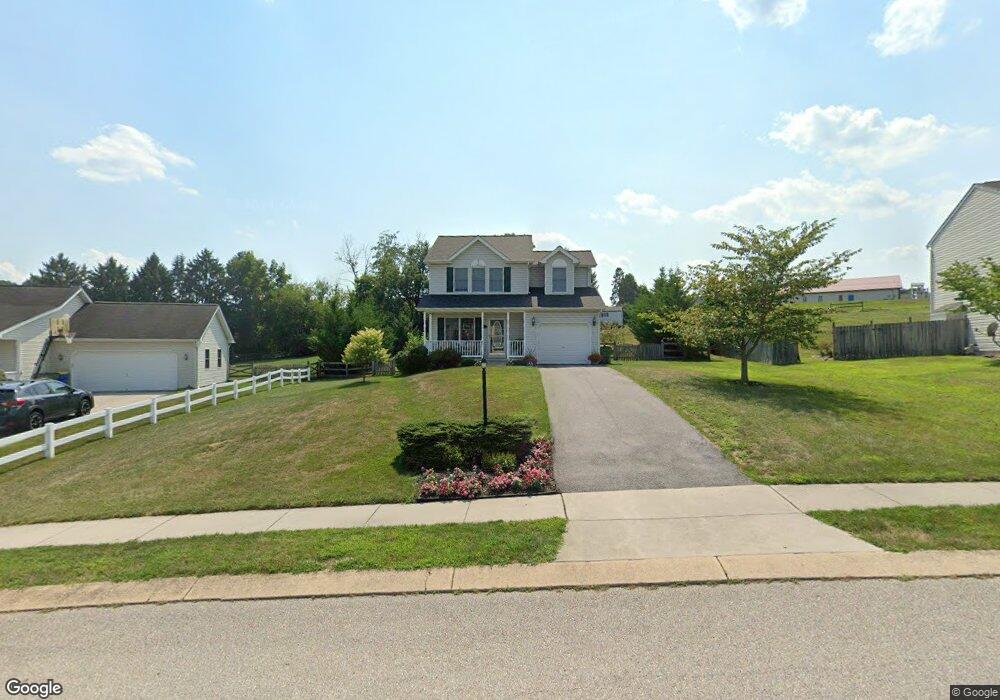
27 Menlena Cir Hanover, PA 17331
Estimated Value: $287,000 - $357,000
3
Beds
4
Baths
1,836
Sq Ft
$181/Sq Ft
Est. Value
About This Home
This home is located at 27 Menlena Cir, Hanover, PA 17331 and is currently estimated at $332,897, approximately $181 per square foot. 27 Menlena Cir is a home located in York County with nearby schools including South Western Senior High School and St Joseph Catholic School.
Ownership History
Date
Name
Owned For
Owner Type
Purchase Details
Closed on
Jul 13, 2011
Sold by
Lancellotti Harry J and Lancellotti Diane T
Bought by
Dodd Peter A and Dodd Angela M
Current Estimated Value
Home Financials for this Owner
Home Financials are based on the most recent Mortgage that was taken out on this home.
Original Mortgage
$146,000
Outstanding Balance
$100,491
Interest Rate
4.52%
Mortgage Type
New Conventional
Estimated Equity
$232,406
Purchase Details
Closed on
Nov 9, 2004
Sold by
Federal National Mortgage Association
Bought by
Lancellotti Harry J and Lancelotti Diane T
Purchase Details
Closed on
Oct 21, 2004
Sold by
Coghill Craig M and Coghill Stacy M
Bought by
Federal National Mortgage Association
Purchase Details
Closed on
May 17, 2001
Sold by
Richard C Fryfogle Inc
Bought by
Coghill Craig M and Coghill Stacy M
Home Financials for this Owner
Home Financials are based on the most recent Mortgage that was taken out on this home.
Original Mortgage
$149,150
Interest Rate
7.03%
Mortgage Type
Construction
Create a Home Valuation Report for This Property
The Home Valuation Report is an in-depth analysis detailing your home's value as well as a comparison with similar homes in the area
Home Values in the Area
Average Home Value in this Area
Purchase History
| Date | Buyer | Sale Price | Title Company |
|---|---|---|---|
| Dodd Peter A | $190,000 | None Available | |
| Lancellotti Harry J | $169,900 | -- | |
| Federal National Mortgage Association | $150,000 | -- | |
| Coghill Craig M | $40,000 | -- |
Source: Public Records
Mortgage History
| Date | Status | Borrower | Loan Amount |
|---|---|---|---|
| Open | Dodd Peter A | $146,000 | |
| Previous Owner | Coghill Craig M | $149,150 |
Source: Public Records
Tax History Compared to Growth
Tax History
| Year | Tax Paid | Tax Assessment Tax Assessment Total Assessment is a certain percentage of the fair market value that is determined by local assessors to be the total taxable value of land and additions on the property. | Land | Improvement |
|---|---|---|---|---|
| 2025 | $5,880 | $176,060 | $65,170 | $110,890 |
| 2024 | $5,880 | $176,060 | $65,170 | $110,890 |
| 2023 | $5,775 | $176,060 | $65,170 | $110,890 |
| 2022 | $5,685 | $176,060 | $65,170 | $110,890 |
| 2021 | $5,426 | $176,060 | $65,170 | $110,890 |
| 2020 | $5,426 | $176,060 | $65,170 | $110,890 |
| 2019 | $5,322 | $176,060 | $65,170 | $110,890 |
| 2018 | $5,234 | $176,060 | $65,170 | $110,890 |
| 2017 | $5,132 | $176,060 | $65,170 | $110,890 |
| 2016 | $0 | $176,060 | $65,170 | $110,890 |
| 2015 | -- | $176,060 | $65,170 | $110,890 |
| 2014 | -- | $176,060 | $65,170 | $110,890 |
Source: Public Records
Map
Nearby Homes
- 80 Menlena Cir
- 71 Menlena Cir
- 225 Ridge View Ln
- 91 Sunset Dr
- 240 Ridge View Ln Unit 37
- 18 Cardinal Dr
- 6 Meadow Ln
- 256 Ridge View Ln Unit 41
- 129 Coastal Dr Unit 71
- 133 Coastal Dr Unit 72
- 260 Ridge View Ln Unit 42
- 14 Garden Ln
- 271 Ridge View Ln Unit 51
- 276 Ridgeview Ln Unit 46
- 279 Ridgeview Ln Unit 49
- 15 Gladys Ct
- 86 Kimberly Dr
- 30 Allen Dr
- 27 Arlene Ct
- 40 Allen Dr