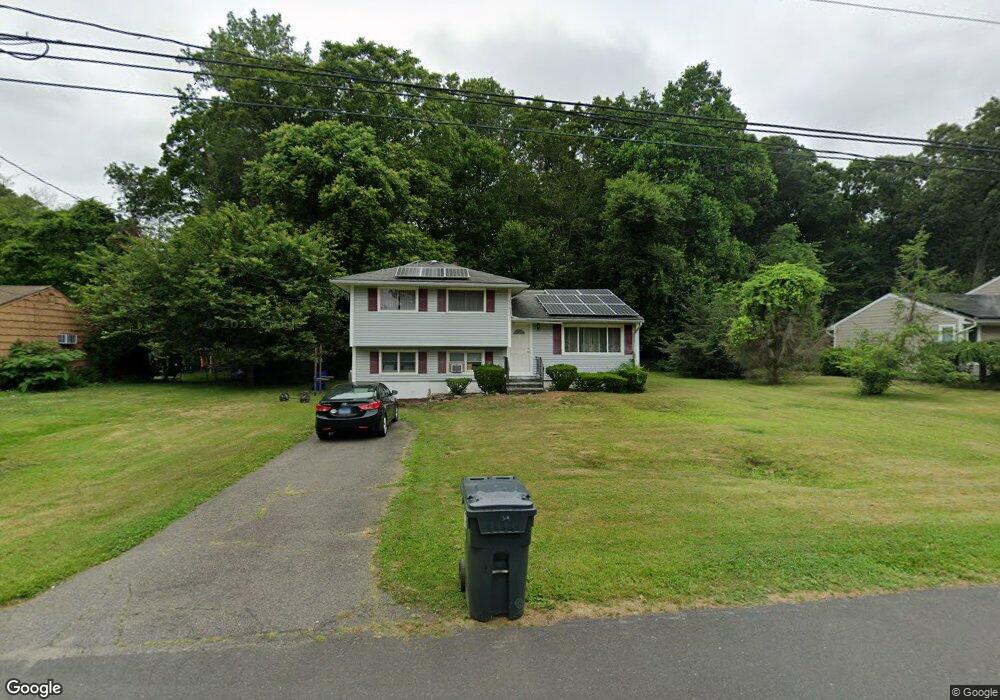
27 Mohawk Dr Norwalk, CT 06851
Cranbury NeighborhoodEstimated Value: $603,000 - $711,000
3
Beds
2
Baths
1,468
Sq Ft
$445/Sq Ft
Est. Value
About This Home
This home is located at 27 Mohawk Dr, Norwalk, CT 06851 and is currently estimated at $653,522, approximately $445 per square foot. 27 Mohawk Dr is a home located in Fairfield County with nearby schools including Cranbury Elementary School, West Rocks Middle School, and Norwalk High School.
Ownership History
Date
Name
Owned For
Owner Type
Purchase Details
Closed on
Mar 31, 1993
Sold by
Maher Lillian
Bought by
Salmone Ralph and Salmone Christine
Current Estimated Value
Home Financials for this Owner
Home Financials are based on the most recent Mortgage that was taken out on this home.
Original Mortgage
$161,500
Interest Rate
7.6%
Mortgage Type
Unknown
Create a Home Valuation Report for This Property
The Home Valuation Report is an in-depth analysis detailing your home's value as well as a comparison with similar homes in the area
Home Values in the Area
Average Home Value in this Area
Purchase History
| Date | Buyer | Sale Price | Title Company |
|---|---|---|---|
| Salmone Ralph | $170,000 | -- | |
| Salmone Ralph | $170,000 | -- |
Source: Public Records
Mortgage History
| Date | Status | Borrower | Loan Amount |
|---|---|---|---|
| Open | Salmone Ralph | $280,675 | |
| Closed | Salmone Ralph | $216,000 | |
| Closed | Salmone Ralph | $146,400 | |
| Closed | Salmone Ralph | $161,500 |
Source: Public Records
Tax History
| Year | Tax Paid | Tax Assessment Tax Assessment Total Assessment is a certain percentage of the fair market value that is determined by local assessors to be the total taxable value of land and additions on the property. | Land | Improvement |
|---|---|---|---|---|
| 2025 | $9,180 | $386,710 | $196,060 | $190,650 |
| 2024 | $9,039 | $386,710 | $196,060 | $190,650 |
| 2023 | $7,210 | $288,790 | $164,500 | $124,290 |
| 2022 | $7,097 | $288,790 | $164,500 | $124,290 |
| 2021 | $6,039 | $288,790 | $164,500 | $124,290 |
| 2020 | $6,817 | $288,790 | $164,500 | $124,290 |
| 2019 | $6,584 | $288,790 | $164,500 | $124,290 |
| 2018 | $7,866 | $303,338 | $177,630 | $125,708 |
| 2017 | $7,591 | $303,330 | $177,630 | $125,700 |
| 2016 | $7,717 | $303,338 | $177,630 | $125,708 |
| 2015 | $6,902 | $302,050 | $177,630 | $124,420 |
| 2014 | $6,765 | $270,170 | $177,630 | $92,540 |
Source: Public Records
Map
Nearby Homes
- 41 Mohawk Dr
- 8 Stonecrop Rd
- 276 Grumman Ave
- 4 Frank St
- 7 Scott St
- 2 Woodley Ln
- 3 Woodley Ln
- 205 E Rocks Rd
- 11 Eastwood Rd
- 152 E Rocks Rd
- 3 Stonybrook Rd
- 9 Trailside Dr
- 30 Freshwater Ln
- 76 Fawn Ridge Ln
- 381 Chestnut Hill Rd
- 3 Tanglewood Ln
- 37 Murray St
- 6 Clara Dr
- 128 Grumman Hill Rd
- 3 Valley View Rd Unit 45
Your Personal Tour Guide
Ask me questions while you tour the home.