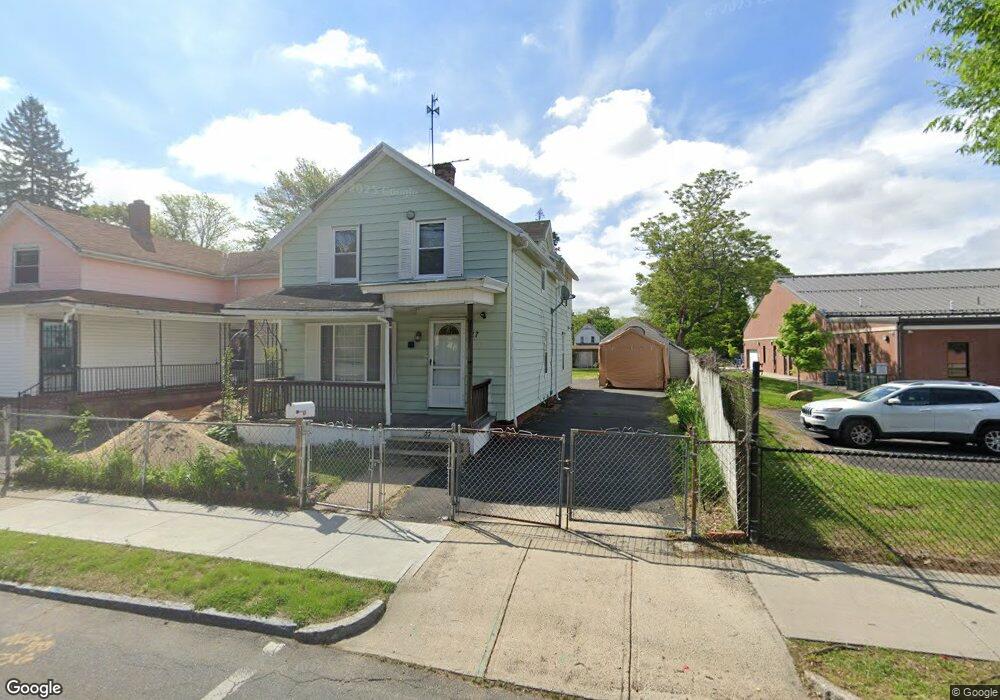
27 Monroe St Springfield, MA 01109
Old Hill NeighborhoodEstimated Value: $185,000 - $249,000
3
Beds
2
Baths
1,247
Sq Ft
$171/Sq Ft
Est. Value
About This Home
This home is located at 27 Monroe St, Springfield, MA 01109 and is currently estimated at $213,355, approximately $171 per square foot. 27 Monroe St is a home located in Hampden County with nearby schools including William N. DeBerry Elementary School, M Marcus Kiley Middle, and High School Of Commerce.
Ownership History
Date
Name
Owned For
Owner Type
Purchase Details
Closed on
Jun 29, 2000
Sold by
Plumtree Assocs Inc
Bought by
Nieves Sylvia
Current Estimated Value
Home Financials for this Owner
Home Financials are based on the most recent Mortgage that was taken out on this home.
Original Mortgage
$22,000
Outstanding Balance
$8,073
Interest Rate
8.59%
Mortgage Type
Purchase Money Mortgage
Estimated Equity
$205,282
Create a Home Valuation Report for This Property
The Home Valuation Report is an in-depth analysis detailing your home's value as well as a comparison with similar homes in the area
Home Values in the Area
Average Home Value in this Area
Purchase History
| Date | Buyer | Sale Price | Title Company |
|---|---|---|---|
| Nieves Sylvia | $52,500 | -- |
Source: Public Records
Mortgage History
| Date | Status | Borrower | Loan Amount |
|---|---|---|---|
| Open | Nieves Sylvia | $22,000 | |
| Closed | Nieves Sylvia | $20,000 |
Source: Public Records
Tax History
| Year | Tax Paid | Tax Assessment Tax Assessment Total Assessment is a certain percentage of the fair market value that is determined by local assessors to be the total taxable value of land and additions on the property. | Land | Improvement |
|---|---|---|---|---|
| 2025 | $1,921 | $122,500 | $25,000 | $97,500 |
| 2024 | $1,877 | $116,900 | $23,400 | $93,500 |
| 2023 | $1,971 | $115,600 | $22,300 | $93,300 |
| 2022 | $1,908 | $101,400 | $20,300 | $81,100 |
| 2021 | $1,828 | $96,700 | $18,400 | $78,300 |
| 2020 | $1,849 | $94,700 | $18,400 | $76,300 |
| 2019 | $1,659 | $84,300 | $18,400 | $65,900 |
| 2018 | $1,439 | $73,100 | $18,400 | $54,700 |
| 2017 | $1,339 | $68,100 | $14,800 | $53,300 |
| 2016 | $1,372 | $69,800 | $14,800 | $55,000 |
| 2015 | $1,316 | $66,900 | $14,800 | $52,100 |
Source: Public Records
Map
Nearby Homes
- 29 Monroe St
- 39 Monroe St
- 45 Monroe St Unit 45R
- 644 Union St
- 45 1/2 Monroe St
- 650 Union St
- 51 Monroe St
- 8 Monroe St Unit First floor
- 658 Union St
- 37 Hancock St
- 665 Union St
- 661 Union St
- 667 Union St
- 647 Union St
- 677 Union St
- 677 Union St Unit 2
- 679 Union St Unit 2
- 679 Union St
- 683 Union St
- 18 Hancock St
Your Personal Tour Guide
Ask me questions while you tour the home.