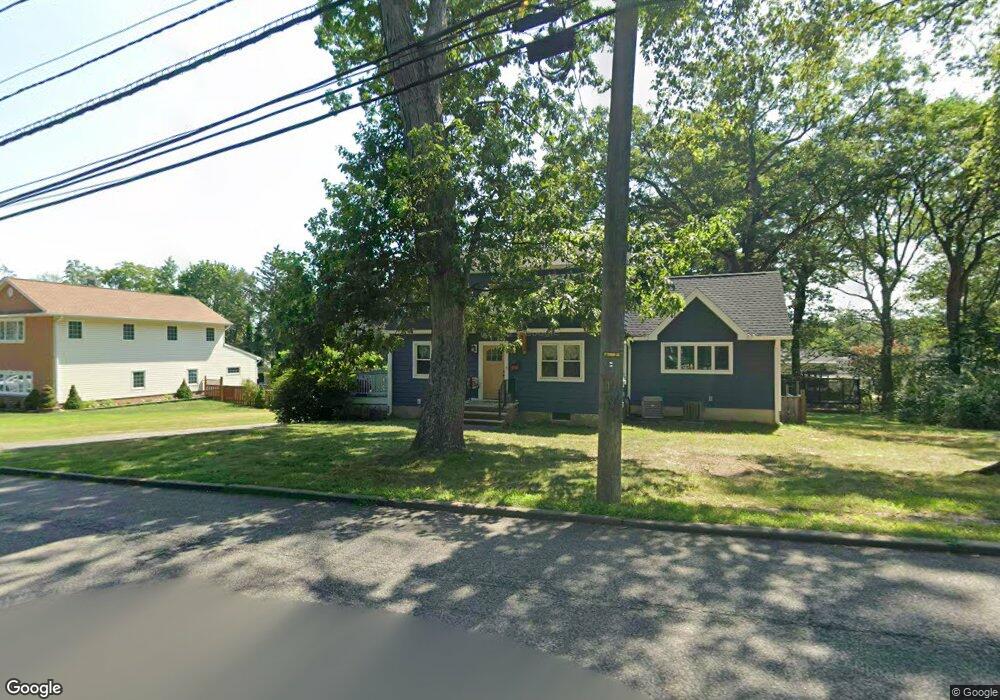
27 Monroe St Waldwick, NJ 07463
Estimated Value: $779,000 - $1,164,737
Studio
--
Bath
2,936
Sq Ft
$343/Sq Ft
Est. Value
About This Home
This home is located at 27 Monroe St, Waldwick, NJ 07463 and is currently estimated at $1,006,434, approximately $342 per square foot. 27 Monroe St is a home located in Bergen County with nearby schools including Waldwick High School, Waldwick Seventh-Day Adventist School, and The Village School - Montessori.
Ownership History
Date
Name
Owned For
Owner Type
Purchase Details
Closed on
Sep 30, 2009
Sold by
Malerich Charles J and Malerich Susan G
Bought by
Blayer Kelly A and Blayer Patricia M
Current Estimated Value
Home Financials for this Owner
Home Financials are based on the most recent Mortgage that was taken out on this home.
Original Mortgage
$400,118
Outstanding Balance
$217,665
Interest Rate
2%
Mortgage Type
Purchase Money Mortgage
Estimated Equity
$788,769
Create a Home Valuation Report for This Property
The Home Valuation Report is an in-depth analysis detailing your home's value as well as a comparison with similar homes in the area
Home Values in the Area
Average Home Value in this Area
Purchase History
| Date | Buyer | Sale Price | Title Company |
|---|---|---|---|
| Blayer Kelly A | $407,500 | -- |
Source: Public Records
Mortgage History
| Date | Status | Borrower | Loan Amount |
|---|---|---|---|
| Open | Blayer Kelly A | $400,118 |
Source: Public Records
Tax History
| Year | Tax Paid | Tax Assessment Tax Assessment Total Assessment is a certain percentage of the fair market value that is determined by local assessors to be the total taxable value of land and additions on the property. | Land | Improvement |
|---|---|---|---|---|
| 2025 | $19,012 | $858,700 | $354,500 | $504,200 |
| 2024 | $12,641 | $858,700 | $354,500 | $504,200 |
| 2023 | $12,380 | $434,700 | $309,200 | $125,500 |
| 2022 | $12,380 | $434,700 | $309,200 | $125,500 |
| 2021 | $12,146 | $434,700 | $309,200 | $125,500 |
| 2020 | $12,028 | $434,700 | $309,200 | $125,500 |
| 2019 | $12,024 | $434,700 | $309,200 | $125,500 |
| 2018 | $11,646 | $434,700 | $309,200 | $125,500 |
| 2017 | $11,546 | $434,700 | $309,200 | $125,500 |
| 2016 | $11,311 | $434,700 | $309,200 | $125,500 |
| 2015 | $11,180 | $434,700 | $309,200 | $125,500 |
| 2014 | $10,911 | $434,700 | $309,200 | $125,500 |
Source: Public Records
Map
Nearby Homes
Your Personal Tour Guide
Ask me questions while you tour the home.