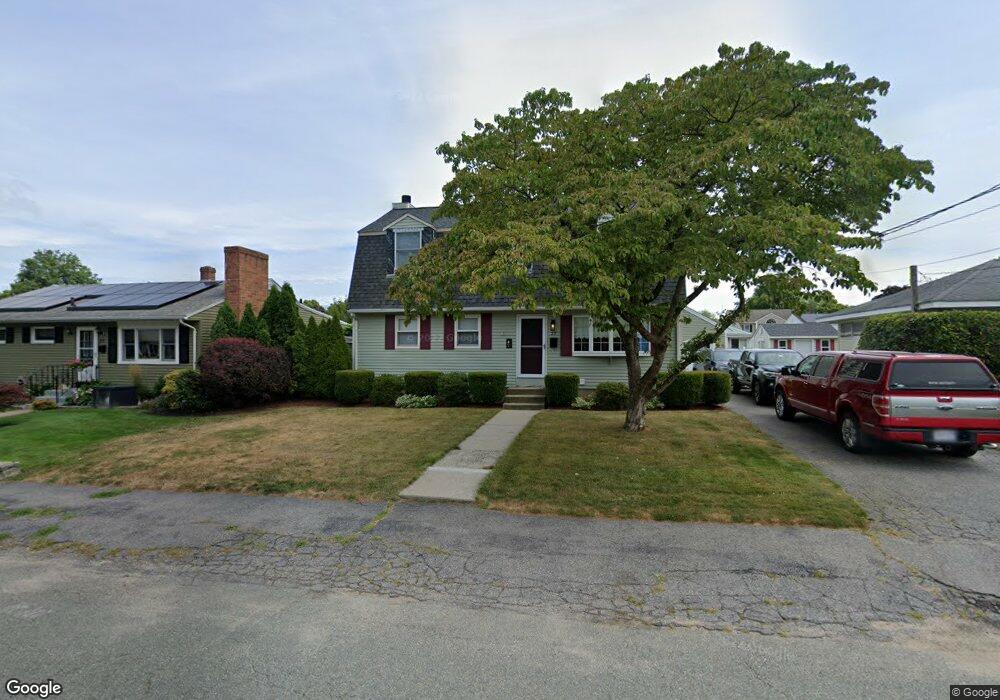
27 Morrison Rd Watertown, MA 02472
West Watertown NeighborhoodEstimated Value: $1,015,120 - $1,405,000
3
Beds
2
Baths
1,813
Sq Ft
$616/Sq Ft
Est. Value
About This Home
This home is located at 27 Morrison Rd, Watertown, MA 02472 and is currently estimated at $1,117,030, approximately $616 per square foot. 27 Morrison Rd is a home located in Middlesex County with nearby schools including The Kendall School, JCDS, Boston's Jewish Community Day School, and Beacon High School.
Ownership History
Date
Name
Owned For
Owner Type
Purchase Details
Closed on
Apr 10, 2018
Sold by
Morris Walter J and Morris Eileen
Bought by
Morris Ft and Morris
Current Estimated Value
Purchase Details
Closed on
Nov 29, 1996
Sold by
Gerard E Welch Inc
Bought by
Harrison Robert P and Harrison Barbara M
Purchase Details
Closed on
Oct 2, 1989
Sold by
Ruggeri Madeline
Bought by
Morris Walter J
Create a Home Valuation Report for This Property
The Home Valuation Report is an in-depth analysis detailing your home's value as well as a comparison with similar homes in the area
Home Values in the Area
Average Home Value in this Area
Purchase History
| Date | Buyer | Sale Price | Title Company |
|---|---|---|---|
| Morris Ft | -- | -- | |
| Morris Ft | -- | -- | |
| Morris Ft | -- | -- | |
| Harrison Robert P | $336,000 | -- | |
| Morris Walter J | $154,000 | -- |
Source: Public Records
Mortgage History
| Date | Status | Borrower | Loan Amount |
|---|---|---|---|
| Previous Owner | Morris Walter J | $150,000 |
Source: Public Records
Tax History Compared to Growth
Tax History
| Year | Tax Paid | Tax Assessment Tax Assessment Total Assessment is a certain percentage of the fair market value that is determined by local assessors to be the total taxable value of land and additions on the property. | Land | Improvement |
|---|---|---|---|---|
| 2025 | $10,664 | $913,000 | $479,800 | $433,200 |
| 2024 | $9,819 | $839,200 | $459,800 | $379,400 |
| 2023 | $10,654 | $784,500 | $437,900 | $346,600 |
| 2022 | $9,620 | $726,000 | $416,000 | $310,000 |
| 2021 | $8,715 | $711,400 | $401,400 | $310,000 |
| 2020 | $8,454 | $696,400 | $386,800 | $309,600 |
| 2019 | $7,933 | $615,900 | $372,200 | $243,700 |
| 2018 | $7,756 | $575,800 | $364,900 | $210,900 |
| 2017 | $7,112 | $512,000 | $313,800 | $198,200 |
| 2016 | $6,550 | $478,800 | $299,200 | $179,600 |
| 2015 | $6,869 | $457,000 | $277,300 | $179,700 |
| 2014 | $6,509 | $435,100 | $255,400 | $179,700 |
Source: Public Records
Map
Nearby Homes
- 253 Sycamore St Unit 253
- 38 Carey Ave Unit 3
- 30 Duff St
- 43 Wilbur St
- 57 Pierce Rd Unit 57
- 71 Gleason St
- 236 Sycamore St
- 24 Gill Rd Unit 4
- 36 Hollace St
- 914 Belmont St
- 356 Lexington St
- 287 Lexington St
- 100 Whitman Rd
- 5 Chapman St
- 172 Westminster Ave Unit 1
- 1 Bridgham Ave
- 109 A Lexington St
- 28 Whitney St
- 654 Main St
- 63 Edenfield Ave
- 23 Morrison Rd
- 31 Morrison Rd
- 22 Jefferson Ave
- 11 Cleveland Rd
- 19 Morrison Rd
- 15 Cleveland Rd
- 28 Morrison Rd
- 18 Jefferson Ave
- 24 Morrison Rd
- 32 Morrison Rd
- 21 Cleveland Rd
- 41 Morrison Rd
- 15 Morrison Rd
- 20 Morrison Rd
- 23 Jefferson Ave
- 37 Jefferson Ave
- 38 Jefferson Ave
- 23 Cleveland Rd
- 16 Morrison Rd
- 19 Jefferson Ave