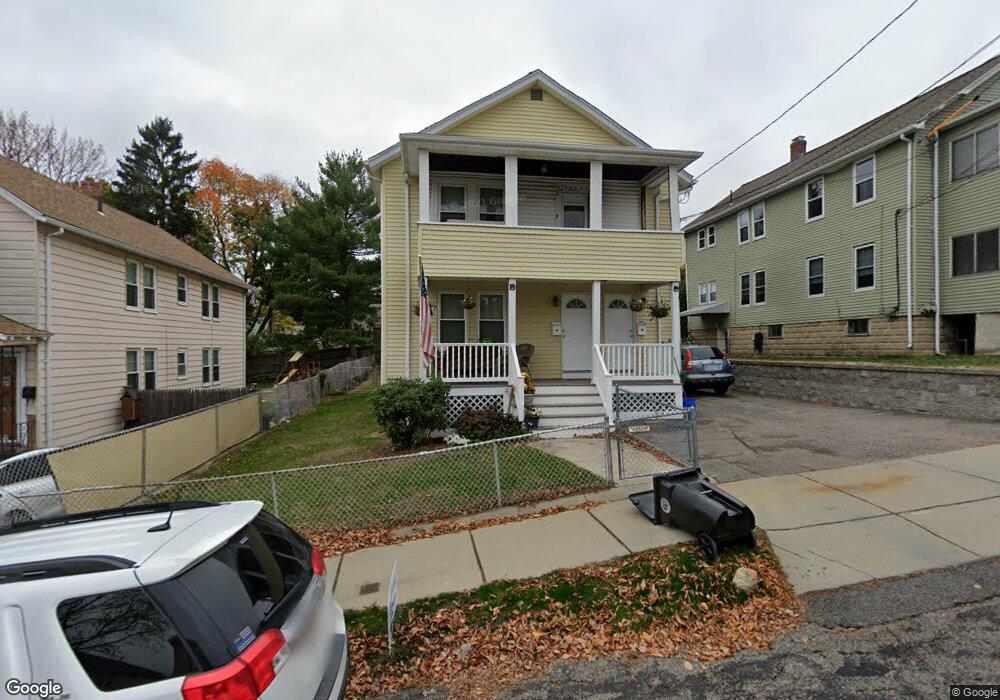
27 Morton St Unit 29 Watertown, MA 02472
West Watertown NeighborhoodEstimated Value: $1,079,000 - $1,177,000
4
Beds
2
Baths
2,236
Sq Ft
$501/Sq Ft
Est. Value
About This Home
This home is located at 27 Morton St Unit 29, Watertown, MA 02472 and is currently estimated at $1,119,717, approximately $500 per square foot. 27 Morton St Unit 29 is a home located in Middlesex County with nearby schools including JCDS, Boston's Jewish Community Day School and Beacon High School.
Ownership History
Date
Name
Owned For
Owner Type
Purchase Details
Closed on
Jun 25, 2024
Sold by
Miller James W
Bought by
Morton Street Rt and Jr-Tr
Current Estimated Value
Purchase Details
Closed on
Nov 26, 2003
Sold by
Macdonald Joyce P
Bought by
Miller James W and Miller Lisa A
Home Financials for this Owner
Home Financials are based on the most recent Mortgage that was taken out on this home.
Original Mortgage
$400,000
Interest Rate
6.09%
Mortgage Type
Purchase Money Mortgage
Create a Home Valuation Report for This Property
The Home Valuation Report is an in-depth analysis detailing your home's value as well as a comparison with similar homes in the area
Home Values in the Area
Average Home Value in this Area
Purchase History
| Date | Buyer | Sale Price | Title Company |
|---|---|---|---|
| Morton Street Rt | -- | None Available | |
| Morton Street Rt | -- | None Available | |
| Miller James W | $500,000 | -- | |
| Miller James W | $500,000 | -- |
Source: Public Records
Mortgage History
| Date | Status | Borrower | Loan Amount |
|---|---|---|---|
| Previous Owner | Miller James W | $261,100 | |
| Previous Owner | Miller James W | $400,000 |
Source: Public Records
Tax History Compared to Growth
Tax History
| Year | Tax Paid | Tax Assessment Tax Assessment Total Assessment is a certain percentage of the fair market value that is determined by local assessors to be the total taxable value of land and additions on the property. | Land | Improvement |
|---|---|---|---|---|
| 2025 | $11,227 | $961,200 | $485,600 | $475,600 |
| 2024 | $10,181 | $870,200 | $471,400 | $398,800 |
| 2023 | $11,551 | $850,600 | $456,200 | $394,400 |
| 2022 | $10,668 | $805,100 | $410,500 | $394,600 |
| 2021 | $9,608 | $784,300 | $402,900 | $381,400 |
| 2020 | $9,245 | $761,500 | $387,700 | $373,800 |
| 2019 | $8,740 | $678,600 | $372,500 | $306,100 |
| 2018 | $8,192 | $608,200 | $330,700 | $277,500 |
| 2017 | $8,448 | $608,200 | $330,700 | $277,500 |
| 2016 | $7,852 | $574,000 | $296,500 | $277,500 |
| 2015 | $7,380 | $491,000 | $281,300 | $209,700 |
| 2014 | $7,345 | $491,000 | $281,300 | $209,700 |
Source: Public Records
Map
Nearby Homes
- 32 Howard St Unit 32
- 35 Bacon St
- 27-29 Edenfield Ave
- 5 Chapman St
- 11 Midland Rd
- 94 Lexington St
- 32 Bacon St
- 7 French St
- 109 A Lexington St
- 63 Edenfield Ave
- 44 Bromfield St
- 78 Chestnut St
- 63-65 Evans St
- 12 Cuba St Unit 12
- 5 Chatham Way Unit 5
- 79 Waverley Ave Unit 79
- 654 Main St
- 9 Bancroft St Unit 11
- 137-139 Pleasant St
- 38 Carey Ave Unit 3
- 29 Morton St
- 27 Morton St Unit 2
- 31 Morton St Unit 33
- 23 Morton St
- 23 Morton St Unit 2
- 35 Morton St
- 19 Morton St
- 19 Morton St Unit 2
- 37 Morton St
- 37 Morton St Unit 1
- 28 Rosedale Rd
- 24 Rosedale Rd
- 36 Morton St Unit 1
- 39 Morton St Unit 39
- 41 Morton St
- 39 Morton St
- 41 Morton St Unit 2
- 39 Morton St Unit 1
- 30 Morton St
- 26 Morton St Unit 28