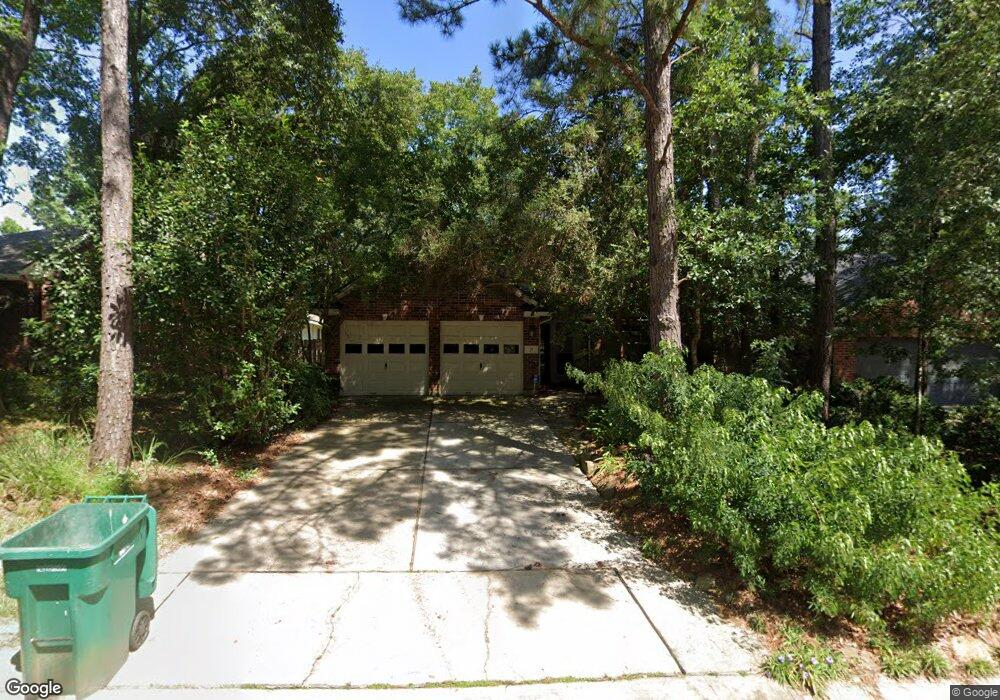
27 Mulberry Glen Place Spring, TX 77382
Alden Bridge NeighborhoodEstimated Value: $389,116 - $470,000
3
Beds
2
Baths
1,859
Sq Ft
$226/Sq Ft
Est. Value
About This Home
This home is located at 27 Mulberry Glen Place, Spring, TX 77382 and is currently estimated at $420,779, approximately $226 per square foot. 27 Mulberry Glen Place is a home located in Montgomery County with nearby schools including Buckalew Elementary School, Mitchell Intermediate School, and McCullough Junior High School.
Ownership History
Date
Name
Owned For
Owner Type
Purchase Details
Closed on
Oct 4, 2004
Sold by
Gilpin Clark Russell and Gilpin Clark Mindy
Bought by
Reeder Geoffrey B
Current Estimated Value
Purchase Details
Closed on
Dec 15, 2000
Sold by
Wood Herman C
Bought by
Reeder Geoffrey B
Home Financials for this Owner
Home Financials are based on the most recent Mortgage that was taken out on this home.
Original Mortgage
$108,800
Interest Rate
7.72%
Purchase Details
Closed on
May 28, 1998
Sold by
Rhone Inc
Bought by
Wood Dr Herman C
Purchase Details
Closed on
May 2, 1998
Sold by
Rhone Inc
Bought by
Reeder Geoffrey B
Purchase Details
Closed on
Nov 14, 1997
Sold by
The Ryland Group Inc
Bought by
Rhone Inc
Home Financials for this Owner
Home Financials are based on the most recent Mortgage that was taken out on this home.
Original Mortgage
$115,600
Interest Rate
8.12%
Create a Home Valuation Report for This Property
The Home Valuation Report is an in-depth analysis detailing your home's value as well as a comparison with similar homes in the area
Home Values in the Area
Average Home Value in this Area
Purchase History
| Date | Buyer | Sale Price | Title Company |
|---|---|---|---|
| Reeder Geoffrey B | -- | First American Title | |
| Reeder Geoffrey B | -- | -- | |
| Gilpin Clark Russell | -- | -- | |
| Wood Dr Herman C | -- | Cornerstone Title Co | |
| Reeder Geoffrey B | -- | -- | |
| Rhone Inc | -- | Cornerstone Title Co |
Source: Public Records
Mortgage History
| Date | Status | Borrower | Loan Amount |
|---|---|---|---|
| Previous Owner | Gilpin Clark Russell | $108,800 | |
| Previous Owner | Rhone Inc | $115,600 |
Source: Public Records
Tax History Compared to Growth
Tax History
| Year | Tax Paid | Tax Assessment Tax Assessment Total Assessment is a certain percentage of the fair market value that is determined by local assessors to be the total taxable value of land and additions on the property. | Land | Improvement |
|---|---|---|---|---|
| 2025 | $2,981 | $362,819 | -- | -- |
| 2024 | $2,968 | $329,835 | -- | -- |
| 2023 | $2,968 | $299,850 | $50,000 | $311,360 |
| 2022 | $5,525 | $272,590 | $50,000 | $293,000 |
| 2021 | $5,405 | $247,810 | $24,110 | $223,700 |
| 2020 | $5,795 | $250,540 | $24,110 | $226,430 |
| 2019 | $5,495 | $230,230 | $24,110 | $206,120 |
| 2018 | $4,497 | $216,000 | $24,110 | $191,890 |
| 2017 | $5,268 | $218,040 | $24,110 | $193,930 |
| 2016 | $4,833 | $200,050 | $24,110 | $228,110 |
| 2015 | $3,824 | $181,860 | $24,110 | $184,770 |
| 2014 | $3,824 | $165,330 | $24,110 | $184,770 |
Source: Public Records
Map
Nearby Homes
- 2 E Sienna Place
- 39 E Honey Grove Place
- 48 W New Avery Place
- 71 N Acacia Park Cir
- 7 Coachman Ridge Place
- 129 Highland Dr
- 225 Fox Trotter
- 101 N Villa Oaks Dr
- 47 Crocus Petal St
- 85 Summer Lark Place
- 35 E Bellmeade Place
- 7 Verbena Bend Place
- 230 S Walden Elms Cir
- 27 Medley Ln
- 26 N Walden Elms Cir
- 27 S Belfair Place
- 35 N Walden Elms Cir
- 6 Tethered Vine Place
- 106 W Bristol Oak Cir
- 35 Serene Creek Place
- 31 Mulberry Glen Place
- 23 Mulberry Glen Place
- 19 Mulberry Glen Place
- 34 Paddock Pines Place
- 30 Paddock Pines Place
- 38 Paddock Pines Place
- 15 Mulberry Glen Place
- 26 Paddock Pines Place
- 26 Mulberry Glen Place
- 22 Mulberry Glen Place
- 18 Mulberry Glen Place
- 11 Mulberry Glen Place
- 22 Paddock Pines Place
- 18 Paddock Pines Place
- 10 Mulberry Glen Place
- 9 Mulberry Glen Place
- 31 Paddock Pines Place
- 39 Paddock Pines Place
- 6 Mulberry Glen Place
- 14 Paddock Pines Place