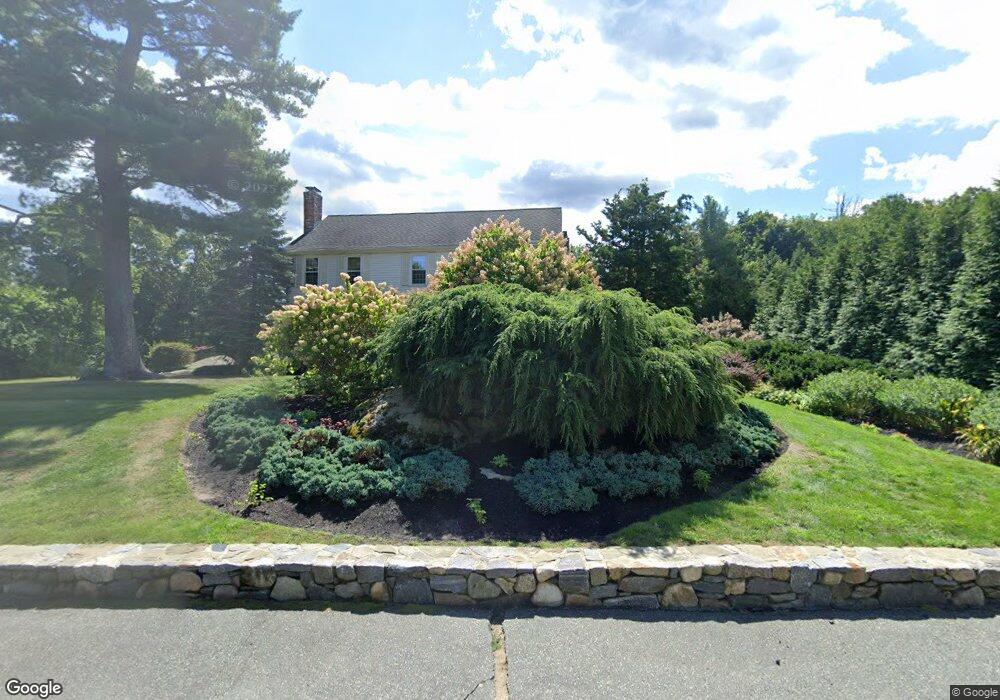
27 Myers Farm Rd Hingham, MA 02043
Estimated Value: $1,550,000 - $1,958,000
4
Beds
3
Baths
2,618
Sq Ft
$646/Sq Ft
Est. Value
About This Home
This home is located at 27 Myers Farm Rd, Hingham, MA 02043 and is currently estimated at $1,690,189, approximately $645 per square foot. 27 Myers Farm Rd is a home located in Plymouth County with nearby schools including Plymouth River Elementary School, South Shore Conservatory of Music Preschool, and St. Paul Elementary School.
Ownership History
Date
Name
Owned For
Owner Type
Purchase Details
Closed on
Sep 6, 2019
Sold by
Glynn John B and Manning-Glynn Ellen
Bought by
Gaven Steven M and Gaven Meaghan M
Current Estimated Value
Home Financials for this Owner
Home Financials are based on the most recent Mortgage that was taken out on this home.
Original Mortgage
$940,000
Outstanding Balance
$825,049
Interest Rate
3.7%
Mortgage Type
Purchase Money Mortgage
Estimated Equity
$865,140
Purchase Details
Closed on
Feb 24, 1989
Sold by
Braun Peter E
Bought by
Glynn John F
Create a Home Valuation Report for This Property
The Home Valuation Report is an in-depth analysis detailing your home's value as well as a comparison with similar homes in the area
Home Values in the Area
Average Home Value in this Area
Purchase History
| Date | Buyer | Sale Price | Title Company |
|---|---|---|---|
| Gaven Steven M | $1,200,000 | -- | |
| Glynn John F | $454,000 | -- |
Source: Public Records
Mortgage History
| Date | Status | Borrower | Loan Amount |
|---|---|---|---|
| Open | Gaven Steven M | $940,000 | |
| Previous Owner | Glynn John F | $200,000 | |
| Previous Owner | Glynn John F | $100,000 | |
| Previous Owner | Glynn John F | $100,000 |
Source: Public Records
Tax History Compared to Growth
Tax History
| Year | Tax Paid | Tax Assessment Tax Assessment Total Assessment is a certain percentage of the fair market value that is determined by local assessors to be the total taxable value of land and additions on the property. | Land | Improvement |
|---|---|---|---|---|
| 2025 | $16,964 | $1,586,900 | $617,300 | $969,600 |
| 2024 | $15,913 | $1,466,600 | $617,300 | $849,300 |
| 2023 | $13,178 | $1,317,800 | $540,200 | $777,600 |
| 2022 | $12,209 | $1,056,100 | $428,600 | $627,500 |
| 2021 | $12,691 | $1,075,500 | $492,900 | $582,600 |
| 2020 | $12,401 | $1,075,500 | $492,900 | $582,600 |
| 2019 | $12,149 | $1,028,700 | $492,900 | $535,800 |
| 2018 | $12,108 | $1,028,700 | $492,900 | $535,800 |
| 2017 | $11,053 | $902,300 | $492,900 | $409,400 |
| 2016 | $10,975 | $878,700 | $469,300 | $409,400 |
| 2015 | $10,723 | $855,800 | $446,400 | $409,400 |
Source: Public Records
Map
Nearby Homes
- 29 Myers Farm Rd
- 25 Myers Farm Rd
- 11 Towerbrook Rd
- 26 Myers Farm Rd
- 13 Towerbrook Rd
- 9 Towerbrook Rd
- 30 Myers Farm Rd
- 15 Towerbrook Rd
- 21 Myers Farm Rd
- 22 Myers Farm Rd
- 15 Tower Brook Rd
- 31 Myers Farm Rd
- 12 Towerbrook Rd
- 16 Tower Brook Rd
- 33 Myers Farm Rd
- 3 Butternut Ln
- 14 Towerbrook Rd
- 19 Towerbrook Rd
- 16 Towerbrook Rd
- 19 Myers Farm Rd