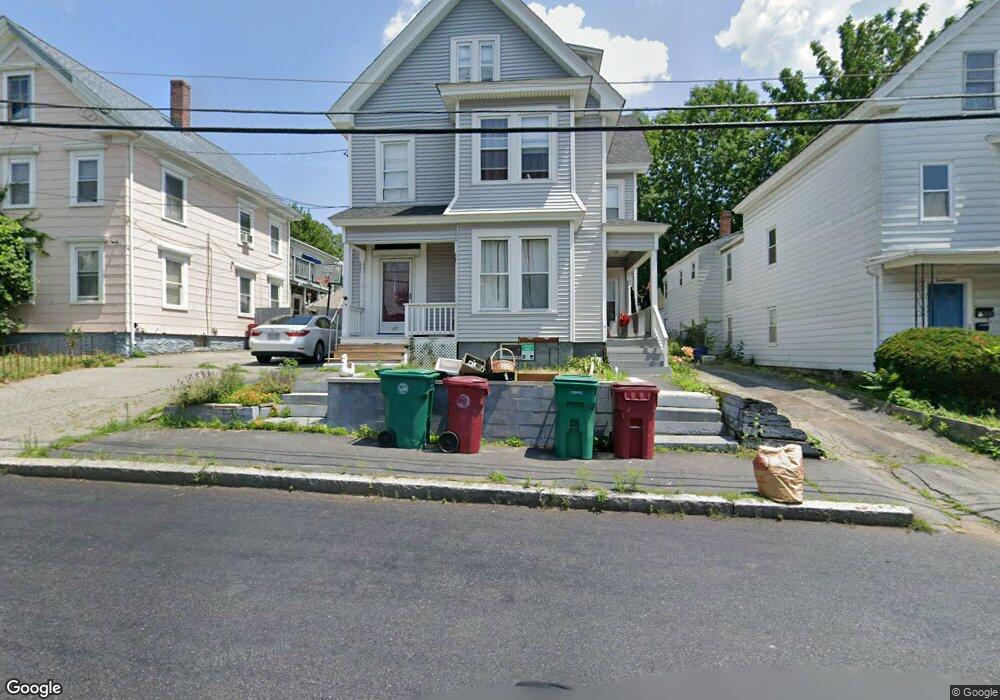
27 Myrtle St Lowell, MA 01850
Centralville NeighborhoodEstimated Value: $629,035 - $712,000
6
Beds
2
Baths
3,322
Sq Ft
$202/Sq Ft
Est. Value
About This Home
This home is located at 27 Myrtle St, Lowell, MA 01850 and is currently estimated at $670,509, approximately $201 per square foot. 27 Myrtle St is a home located in Middlesex County with nearby schools including Greenhalge Elementary School, S. Christa McAuliffe Elementary School, and Moody Elementary School.
Ownership History
Date
Name
Owned For
Owner Type
Purchase Details
Closed on
May 1, 2003
Sold by
Grand Kevin R and Grand Susan M
Bought by
Njenga Julia and Karanja Paul
Current Estimated Value
Home Financials for this Owner
Home Financials are based on the most recent Mortgage that was taken out on this home.
Original Mortgage
$286,502
Outstanding Balance
$124,791
Interest Rate
5.82%
Mortgage Type
Purchase Money Mortgage
Estimated Equity
$545,718
Create a Home Valuation Report for This Property
The Home Valuation Report is an in-depth analysis detailing your home's value as well as a comparison with similar homes in the area
Home Values in the Area
Average Home Value in this Area
Purchase History
| Date | Buyer | Sale Price | Title Company |
|---|---|---|---|
| Njenga Julia | $289,900 | -- | |
| Njenga Julia | $289,900 | -- |
Source: Public Records
Mortgage History
| Date | Status | Borrower | Loan Amount |
|---|---|---|---|
| Open | Njenga Julia | $286,502 | |
| Closed | Njenga Julia | $286,502 | |
| Previous Owner | Njenga Julia | $80,000 |
Source: Public Records
Tax History
| Year | Tax Paid | Tax Assessment Tax Assessment Total Assessment is a certain percentage of the fair market value that is determined by local assessors to be the total taxable value of land and additions on the property. | Land | Improvement |
|---|---|---|---|---|
| 2025 | $6,778 | $590,400 | $133,400 | $457,000 |
| 2024 | $6,293 | $528,400 | $124,700 | $403,700 |
| 2023 | $5,851 | $471,100 | $108,400 | $362,700 |
| 2022 | $5,412 | $426,500 | $98,600 | $327,900 |
| 2021 | $5,015 | $372,600 | $85,700 | $286,900 |
| 2020 | $4,532 | $339,200 | $74,900 | $264,300 |
| 2019 | $4,112 | $292,900 | $69,300 | $223,600 |
| 2018 | $3,914 | $272,000 | $66,000 | $206,000 |
| 2017 | $3,699 | $247,900 | $60,000 | $187,900 |
| 2016 | $3,737 | $246,500 | $58,600 | $187,900 |
| 2015 | $3,440 | $222,200 | $58,600 | $163,600 |
| 2013 | $3,112 | $207,300 | $68,500 | $138,800 |
Source: Public Records
Map
Nearby Homes
- 105 3rd St
- 27-29 Fifth St
- 94 1st St Unit 10
- 25 Read St
- 3 Vernon St
- 45 W 4th St
- 106 Methuen St Unit B
- Lot 11 Christian St
- Lot 12 Christian St
- Lot 9 Christian St
- Lot 10 Christian St
- Lots 1-12 Christian Hill Dev
- 81 Reservoir St
- 52 Christian St
- 42 Christian St
- 18 May St
- 118 W 6th St
- 164 Bradley St
- 130 John St Unit G45
- 130 John St Unit 350
Your Personal Tour Guide
Ask me questions while you tour the home.